 A short introduction to MSparkles
Concepts
Main ideaMSparkles is designed to be an easy-to-use tool for analyzing time-dependent fluorescence microscopy data. Easy-to-use means several things: you don't have to be an image analysis expert, the program is controlled via a graphical user interface (GUI) which provides visual feedback wherever possible. It also means, that we try to automate many processes. For example, MSparkles automatically keeps track of your datasets, analysis configurations and, of course, your results. On top of that, it can automatically generate Excel sheets, PDF reports and graphs for further analyses and presentations.
MSparkles never changes your original data. Instead, after pre-processing and F0 computation, a new copy of the dataset is saved and used for subsequent processing. This is essential for a sound and reproducible data analysis.
Active datasetMSparkles comes with a built-in data manager which keeps track of all your datasets and configurations. However, since typical 2D or 3D time-dependent datasets are usually quite large, you can only have one dataset opened at a time. This is called the active dataset. To load a dataset, simply double-click on the dataset you want to load, or select it and click Load in the menu bar. MSparkles will now load all data associated to this dataset, including results, computed baselines etc. When a dataset is loaded, MSparkles will by default select Activity dependent analysis as active analysis.
Analysis modesMSparkles allows to create ROIs in multiple ways, activity based analysis (automatic detection of static ROIs), ROI-grid analysis, Global ROI analysis and manual drawn ROI analysis. Thereby, you can configure multiple ROI detectors for a single dataset. But, at any time, only one of this analyses can be selected as active. Selecting an analysis as active does not exclude the others from the analysis. It rather defines which set of ROIs and corresponding traces are currently being displayed. This is important to keep in mind, especially when manually drawing ROIs (see below).
User interface
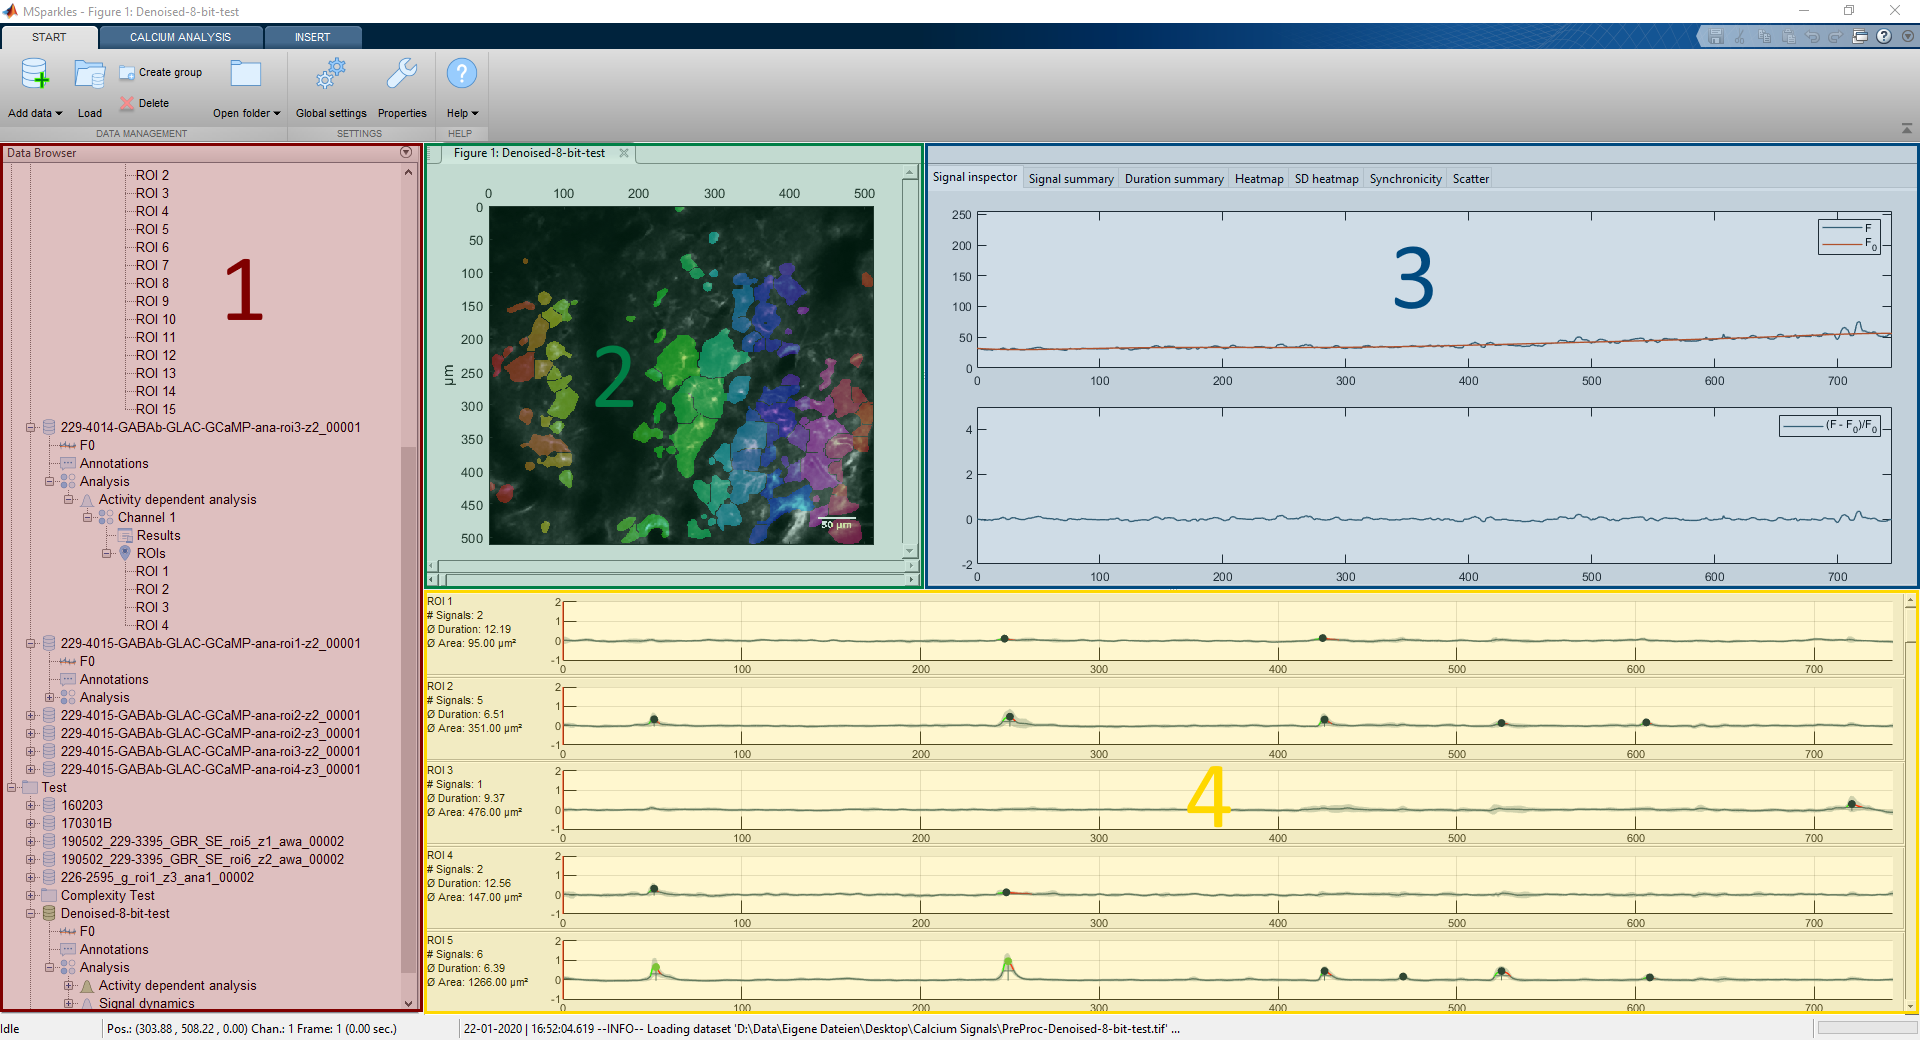
The user-interface is subdivided into four regions, project manager (1), preview window (2), trace inspector(3) and the results view (4). At the bottom of the window, you can find the status bar. It shows the current status of MSparkles, the mouse position, when hovering over the preview window, as well as the most recent log-message. FInally, the status bar contains a progress bar on its far right side, displaying the overall progress of the current operation.
Project manager
GroupsThe project manager allows you to create virtual folders, called groups to organize your datasets. Groups can be created by clicking Create group in the menu bar. Groups created with MSparkles are represented with folders on your local filesystem. IN windows, you can find these folder structures in your Documents folder, typically located at C:\users\UserName\Dokuments\MSparkels Projects.
DatasetsYou can add one or more datasets by selecting the target group in the project manager and then clicking Add data in the menu bar. If no group is selected, MSparkles will add your files to the root node of the project manager. The files you select in the upcomming dialog are then referenced by MSparkles and not copied. All data generated by MSparkles are saved to the folder of your original dataset. (If your dataset is located on a network server MSparkles will also save its results to the same location on that server.)
Analysis & processing settingsTo edit any step of MSparkles processing pipeline you have two options. You can select any existing analysis and click properties in the menu bar. This will directly open the configuration dialog of the selected analysis and allow to to fine-tune your parameters. Alternatively, you can select multiple datasets, or even folders and click Edit in the dropdown menu of one of the pipeline steps in the Calcium analysis tab in the menu bar. This way you can edit multiple datasets and analyses at once. Please keep in mind that the parameter preview is only available for the currently loaded dataset.
Processing & data analysisTo run the entire processing pipeline or a part of it, you can select the dataset(s) or analyses you want to process in the Project manager and then click the setp of the processing pipeline you want to run in the menu bar. If no selection is made in the project manager, the current dataset is processed with all configured analyses. To make the analysis process easier, MSprkles verifies if all required prerequisites are met, e.g. if you click analysis MSparkles checks wether pre-processing, F0 estimation and ROI detection have already been executed. If one or all of these steps are missing, they are automatically added to the processing pipeline. If they have already been executed, these steps will be skipped. Please note, if an earlier stage of the pipeline is re-run, all subsequent results will be deleted. This is neccessary to always maintain a consistent state.
Preview window
BasicsThe preview-window is basically a simple video player, allowing to browse through the current dataset. Besides that, it can show the ROI-set of the active analysis mode as an overlay and allows to select ROIs. Additionally, you can choose various visualization methods from the menu bar and look at different aspects of your dataset. You can also manually drag the position marker of the preview-windows scroll bar to quickly browse through your dataset.
Drawing ROIsBesides showing your data and selecting ROIs, you can also draw ROIs by yourself. Therefore, you can activate one of the ROI-tools from the toolbar and manually draw ROIs. These manually drawn ROIs are treated exactly the same way as auto-generated ROIs. However, besides being simply added they can be merged or cut with any already existing ROI. Please remenber to deactivate the ROI tool, once you are done drawing ROIs.
Signal inspector
When hovering the mouse over the preview window, the signal trace view displays the time course of the current pixel under your mouse pointer. If MSparkles has already performed a baseline computation, the signal trace view will display the original time couse plus the computed baseline. Additionally, it will display the result of the selected detrending / normalization scheme in a seperate graph.
Results view
The results view displays the time courses of all ROIs belonging to the active analysis mode. Its only purpose is to give you a first look at the signals in your data. Additionally, it displays signal counts on the left side of each graph. The detected signals are grouped, according to their relative signal strengh. By default, three signal classes are created with the following intervals [0.5 , 1) , [1 , 1.5) and [1.5 , ∞).