Figures for manuscript
Will Macnair
Institute for Molecular Life Sciences, University of Zurich, SwitzerlandApril 06, 2022
Last updated: 2022-04-06
Checks: 5 2
Knit directory: MS_lesions_snRNAseq/
This reproducible R Markdown analysis was created with workflowr (version 1.7.0). The Checks tab describes the reproducibility checks that were applied when the results were created. The Past versions tab lists the development history.
The R Markdown file has unstaged changes. To know which version of the R Markdown file created these results, you’ll want to first commit it to the Git repo. If you’re still working on the analysis, you can ignore this warning. When you’re finished, you can run wflow_publish to commit the R Markdown file and build the HTML.
The global environment had objects present when the code in the R Markdown file was run. These objects can affect the analysis in your R Markdown file in unknown ways. For reproduciblity it’s best to always run the code in an empty environment. Use wflow_publish or wflow_build to ensure that the code is always run in an empty environment.
The following objects were defined in the global environment when these results were created:
| Name | Class | Size |
|---|---|---|
| q | function | 1008 bytes |
The command set.seed(20210118) was run prior to running the code in the R Markdown file. Setting a seed ensures that any results that rely on randomness, e.g. subsampling or permutations, are reproducible.
Great job! Recording the operating system, R version, and package versions is critical for reproducibility.
Nice! There were no cached chunks for this analysis, so you can be confident that you successfully produced the results during this run.
Great job! Using relative paths to the files within your workflowr project makes it easier to run your code on other machines.
Great! You are using Git for version control. Tracking code development and connecting the code version to the results is critical for reproducibility.
The results in this page were generated with repository version 8f6077d. See the Past versions tab to see a history of the changes made to the R Markdown and HTML files.
Note that you need to be careful to ensure that all relevant files for the analysis have been committed to Git prior to generating the results (you can use wflow_publish or wflow_git_commit). workflowr only checks the R Markdown file, but you know if there are other scripts or data files that it depends on. Below is the status of the Git repository when the results were generated:
Ignored files:
    Ignored:    .Rprofile
    Ignored:    ._MS_lesions_snRNAseq.sublime-project
    Ignored:    MS_lesions_snRNAseq.sublime-project
    Ignored:    MS_lesions_snRNAseq.sublime-workspace

Unstaged changes:
    Modified:   analysis/ms99_manuscript_figures.Rmd
Note that any generated files, e.g. HTML, png, CSS, etc., are not included in this status report because it is ok for generated content to have uncommitted changes.
These are the previous versions of the repository in which changes were made to the R Markdown (analysis/ms99_manuscript_figures.Rmd) and HTML (public/ms99_manuscript_figures.html) files. If you’ve configured a remote Git repository (see ?wflow_git_remote), click on the hyperlinks in the table below to view the files as they were in that past version.
| File | Version | Author | Date | Message |
|---|---|---|---|---|
| Rmd | fa297e8 | Macnair | 2022-03-18 | Tweak manuscript figures |
| html | fa297e8 | Macnair | 2022-03-18 | Tweak manuscript figures |
| Rmd | 1f90a86 | wmacnair | 2022-03-06 | Tweak DE figures |
| Rmd | 8a65d49 | wmacnair | 2022-02-26 | Latest round of figure updates |
| html | 8a65d49 | wmacnair | 2022-02-26 | Latest round of figure updates |
| html | 6898d6f | wmacnair | 2022-02-25 | Update ms99 figures |
| Rmd | 66fb871 | wmacnair | 2022-02-23 | Update main figures |
| html | 66fb871 | wmacnair | 2022-02-23 | Update main figures |
| Rmd | 94c5b4c | wmacnair | 2022-02-21 | Reorder Figure 1 panels |
| html | 94c5b4c | wmacnair | 2022-02-21 | Reorder Figure 1 panels |
| Rmd | f530419 | wmacnair | 2022-02-21 | Update Figure 1 panels in ms99_manuscript_figures |
| html | f530419 | wmacnair | 2022-02-21 | Update Figure 1 panels in ms99_manuscript_figures |
| Rmd | 6a196db | wmacnair | 2022-02-18 | Tweak ms99_figures |
| html | 6a196db | wmacnair | 2022-02-18 | Tweak ms99_figures |
| Rmd | da4d988 | wmacnair | 2022-02-18 | Tidy ms99_manuscript_figures |
| html | da4d988 | wmacnair | 2022-02-18 | Tidy ms99_manuscript_figures |
| Rmd | 8e47b9f | wmacnair | 2022-02-18 | Add logFC heatmaps for selected genes |
| html | 8e47b9f | wmacnair | 2022-02-18 | Add logFC heatmaps for selected genes |
| Rmd | 2c2025a | wmacnair | 2022-02-18 | Add GSEA figures to manuscript figures |
| Rmd | 3c280df | wmacnair | 2022-02-16 | Update ms99 figures report |
| html | 3c280df | wmacnair | 2022-02-16 | Update ms99 figures report |
| Rmd | dd98908 | wmacnair | 2022-02-14 | Update figure orderings again |
| html | dd98908 | wmacnair | 2022-02-14 | Update figure orderings again |
| Rmd | fcc465f | wmacnair | 2022-02-11 | Tweak QC metric heatmaps |
| html | fcc465f | wmacnair | 2022-02-11 | Tweak QC metric heatmaps |
| Rmd | b190aa8 | wmacnair | 2022-02-10 | Update figure ordering |
| html | b190aa8 | wmacnair | 2022-02-10 | Update figure ordering |
| Rmd | ed9415e | wmacnair | 2022-02-10 | Update cluster entropy plots |
| html | ed9415e | wmacnair | 2022-02-10 | Update cluster entropy plots |
| Rmd | aedfb86 | wmacnair | 2022-02-09 | Make and add supp figs on QC metric summaries |
| html | aedfb86 | wmacnair | 2022-02-09 | Make and add supp figs on QC metric summaries |
| Rmd | 14aeb60 | wmacnair | 2022-02-03 | Tidy some unused supp figs |
| html | 14aeb60 | wmacnair | 2022-02-03 | Tidy some unused supp figs |
| Rmd | 1557f44 | wmacnair | 2022-02-03 | Update manuscript figures with supp figs |
| html | 1557f44 | wmacnair | 2022-02-03 | Update manuscript figures with supp figs |
| Rmd | 3755a05 | wmacnair | 2022-02-02 | Update manuscript figures markdown |
| html | 3755a05 | wmacnair | 2022-02-02 | Update manuscript figures markdown |
| Rmd | fea6733 | wmacnair | 2022-01-27 | Update location of manuscript figures |
| html | fea6733 | wmacnair | 2022-01-27 | Update location of manuscript figures |
Setup / definitions
Libraries
Helper functions
source('code/ms00_utils.R')
library("knitr")
Figure 1
A
Cartoon of study design.
include_graphics("figure/additional_figures/study_cartoon.png", error = FALSE)
B
UMAP applied to subset of 100k cells (subset because of memory limits), using parameters min_dist = 1, spread = 2, otherwise defaults. Clusters are determined by Louvain clustering applied to the conos graph, followed by post-hoc splitting of two clusters based on biological expectations (COPs and immune cells), and merging of very similar clusters (using SCCAF).
include_graphics("figure/ms12_markers.Rmd/plot_umap_final_celltypes_sel-1.png", error = FALSE)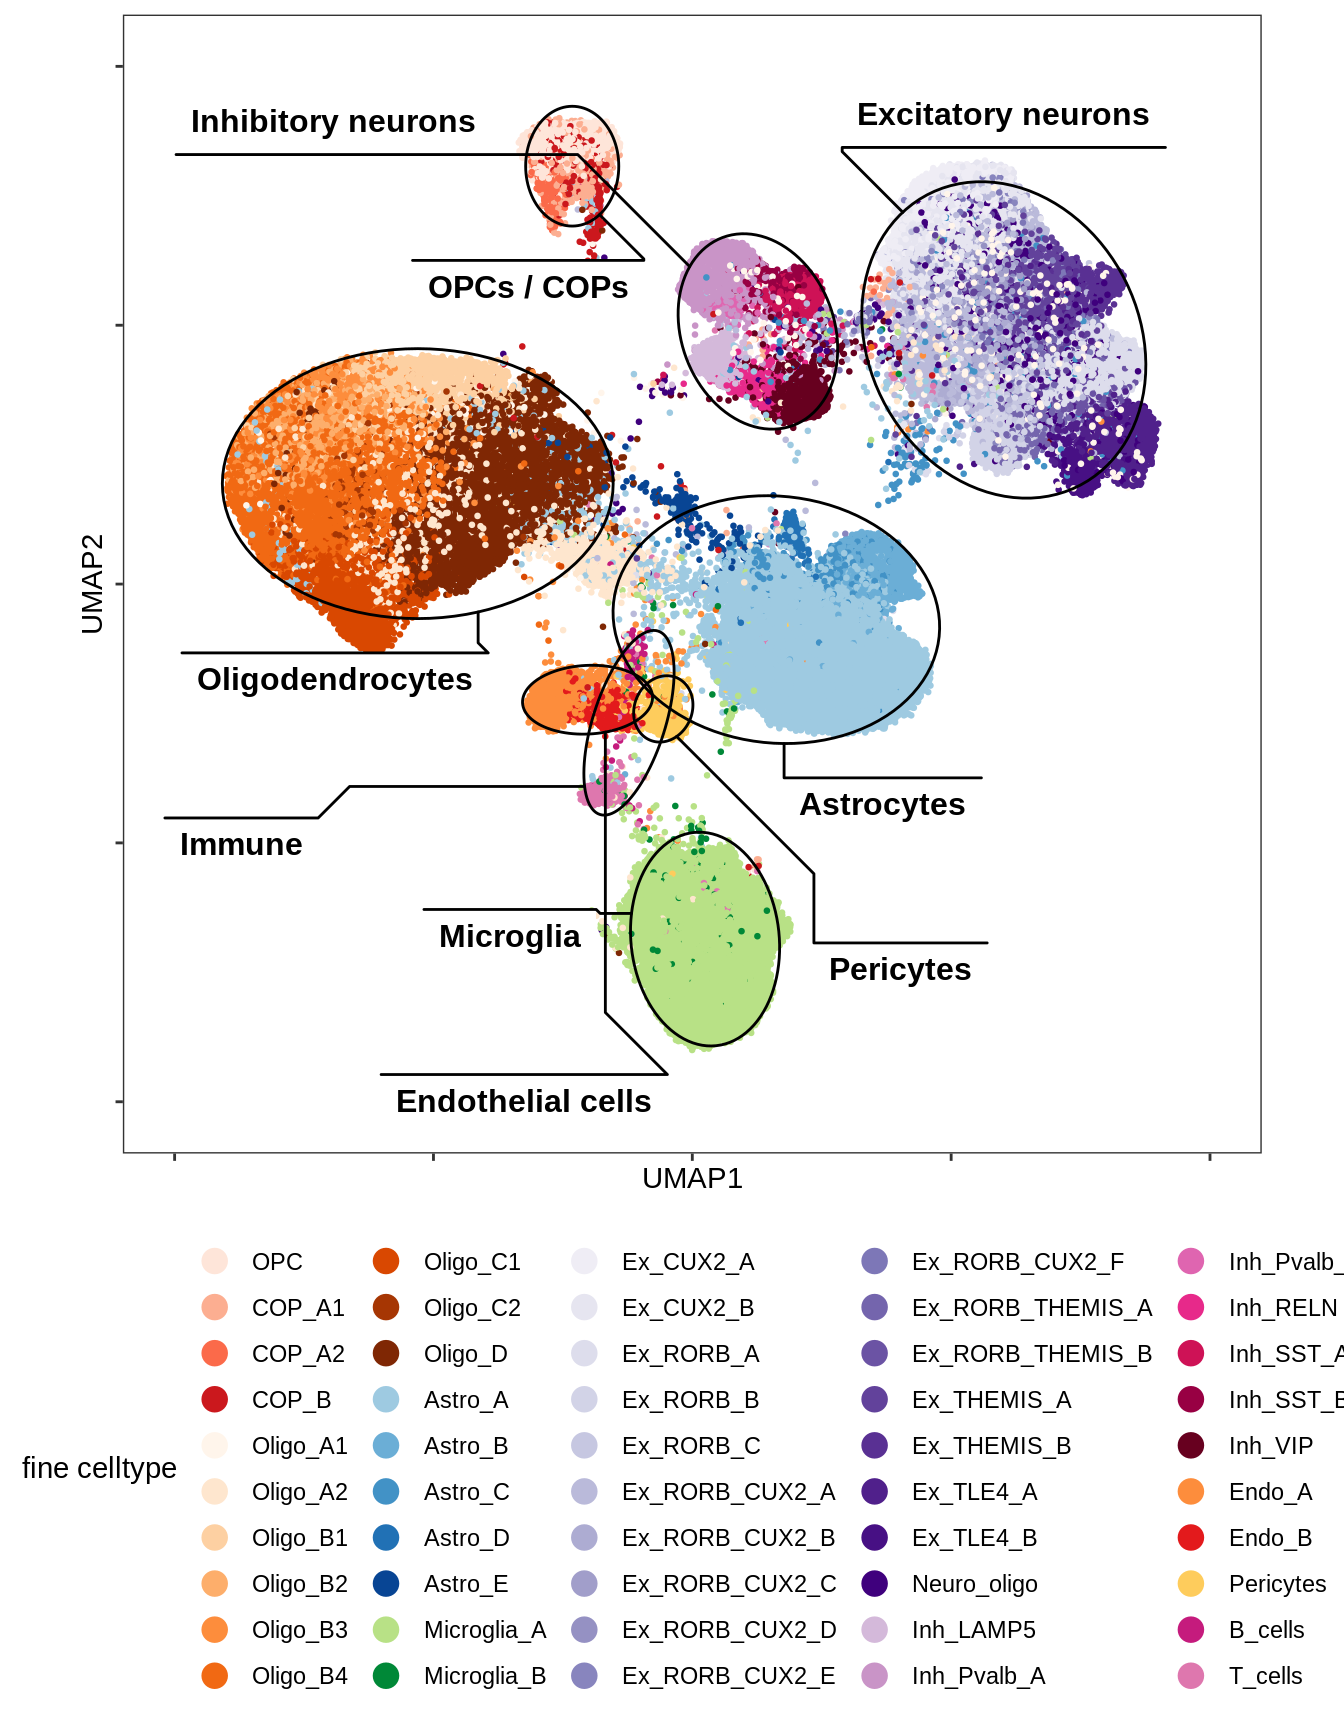
C
UMAP plot of just oligodendrocyte and OPC celltypes.
include_graphics("figure/ms08_modules.Rmd/plot_umap_oligos-1.png", error = FALSE)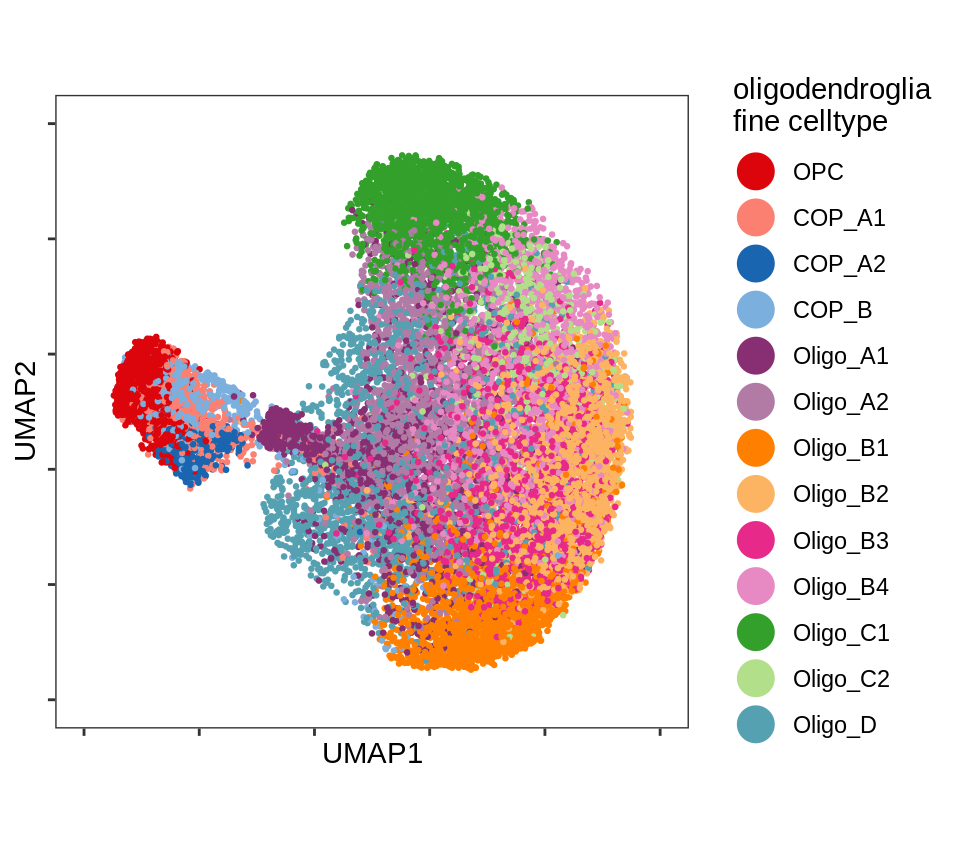
D
UMAP for all celltypes annotated with MS / CTR and WM / GM.
include_graphics("figure/ms08_modules.Rmd/plot_umap_ctr_ms-1.png", error = FALSE)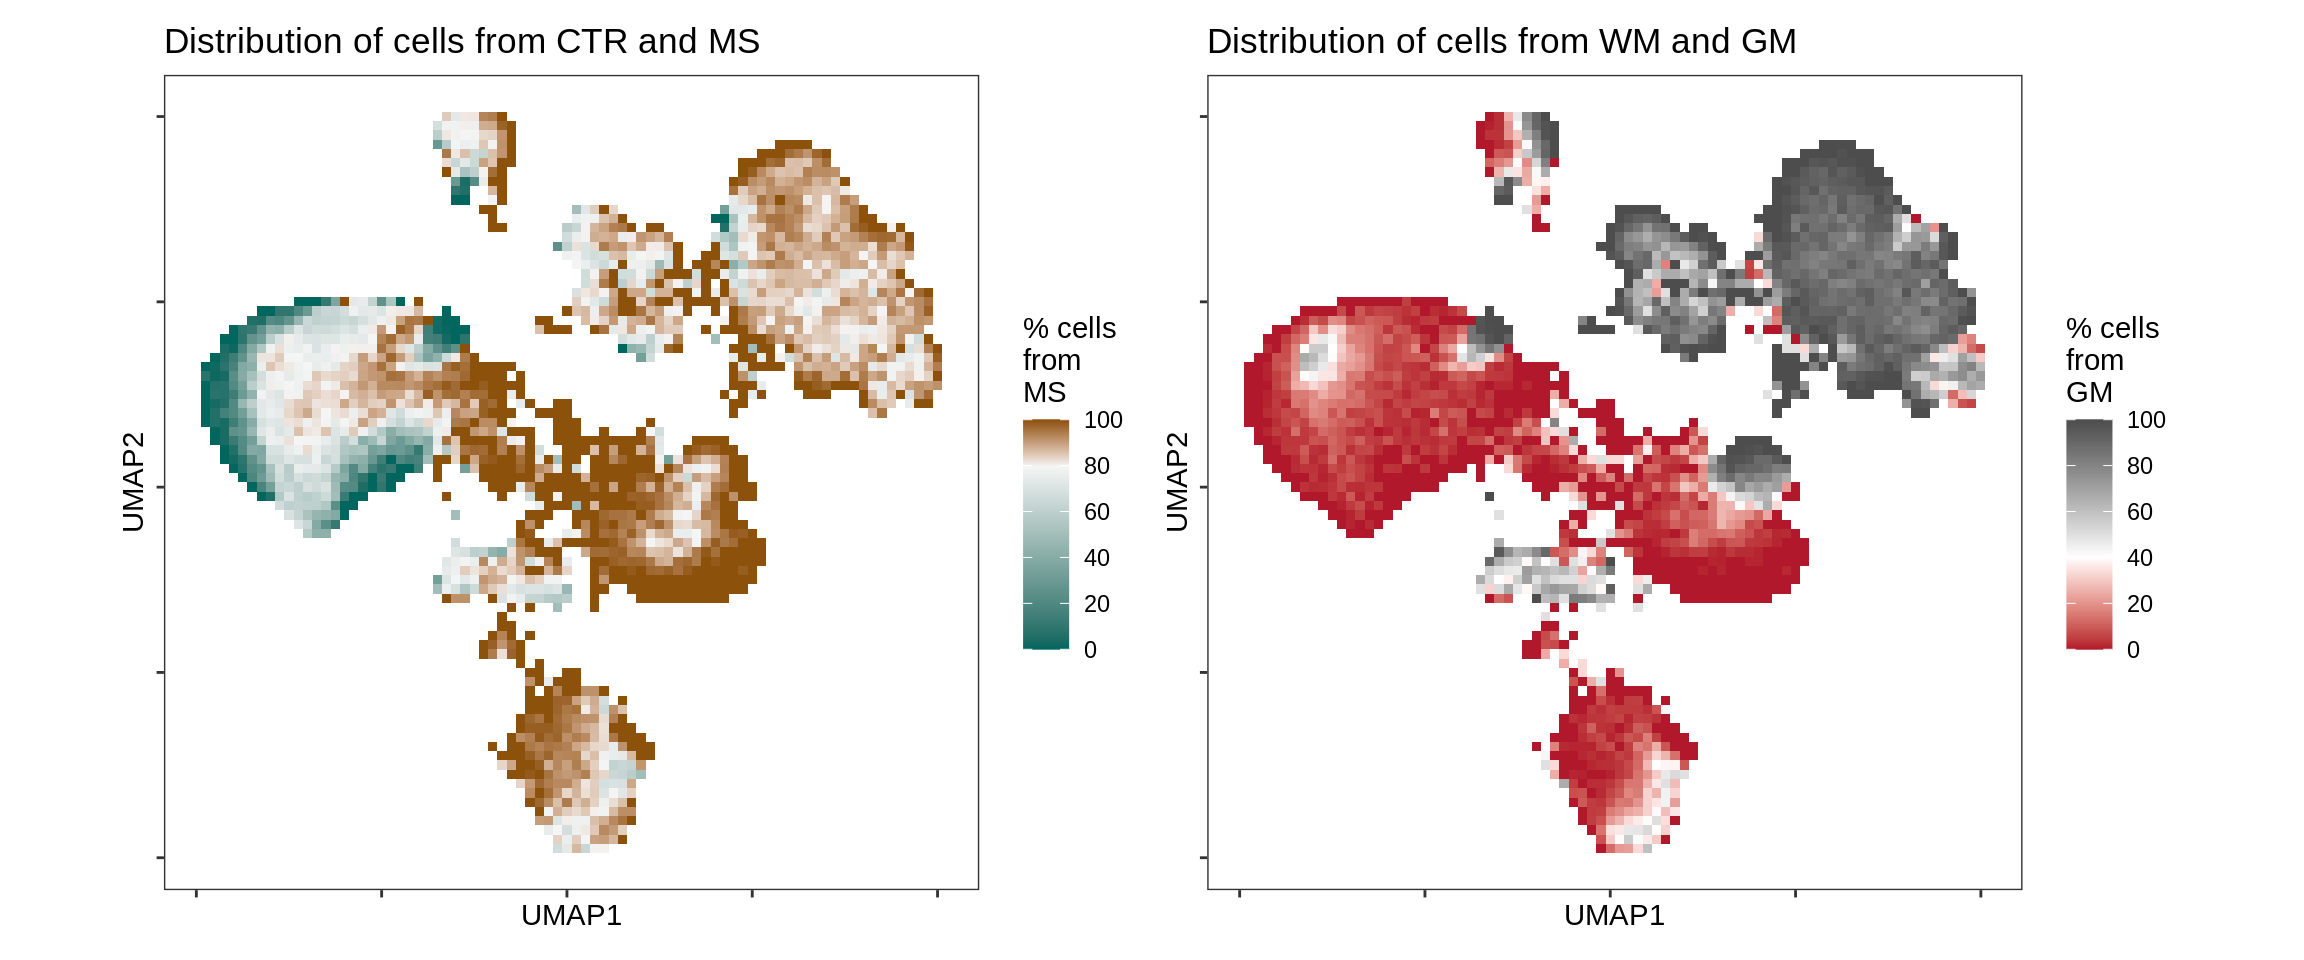
E
Median oNMF module score per fine celltype for OPC and oligo modules and cells. Columns are scaled to have max value equal to 1.
include_graphics("figure/ms08_modules.Rmd/plot_scores_by_type_scaled-1.png", error = FALSE)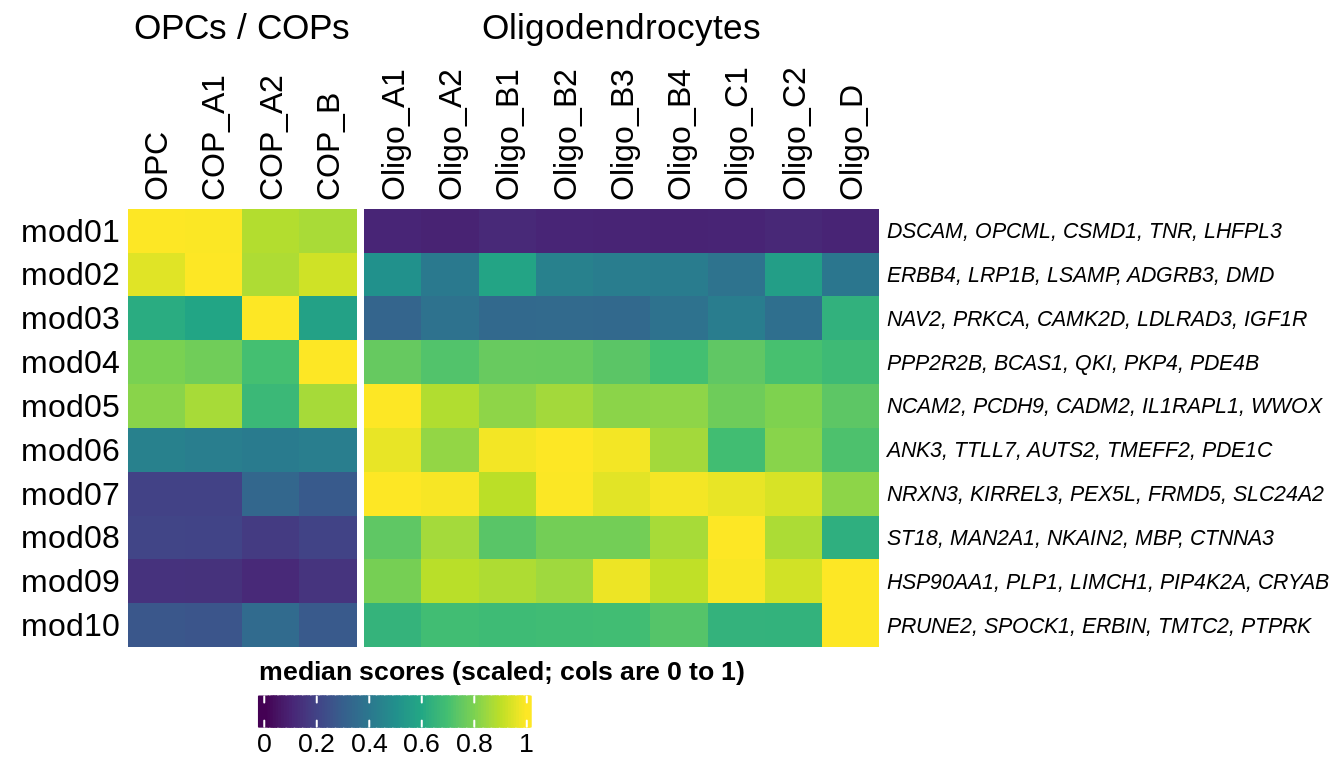
F
PAGA applied to oligodendrocytes and OPCs / COPs across all samples.
include_graphics("figure/ms11_paga.Rmd/plot_paga_olg_wm_gm-1.png", error = FALSE)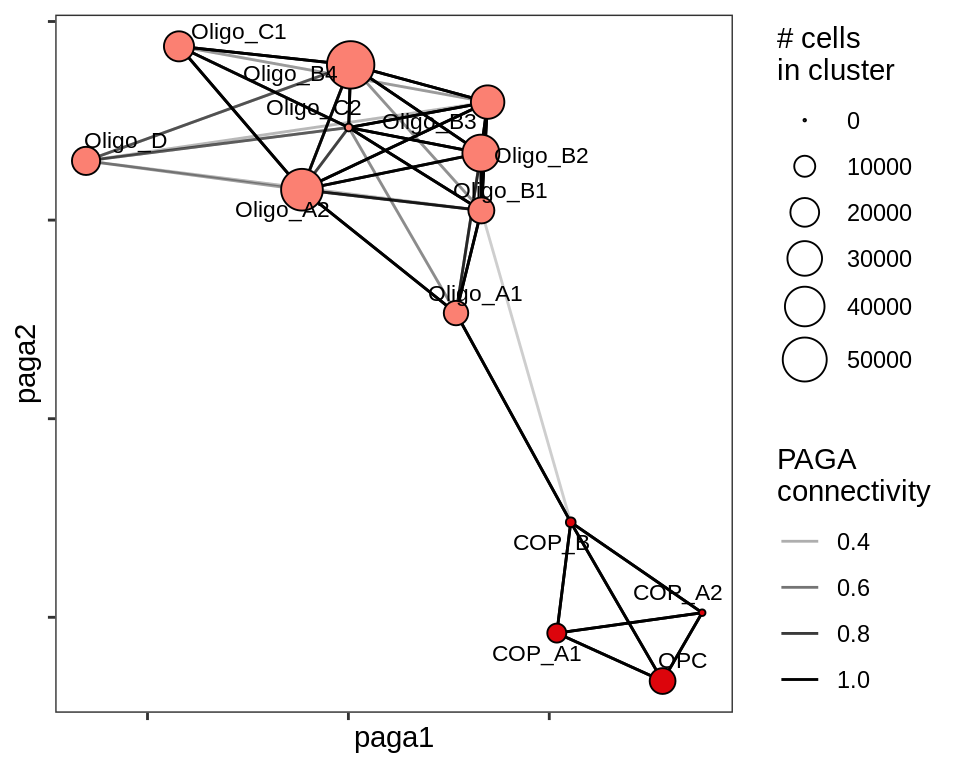
G
include_graphics("figure/ms99_deg_figures_wm.Rmd/plot_de_barplot_gm_wm-1.png", error = FALSE)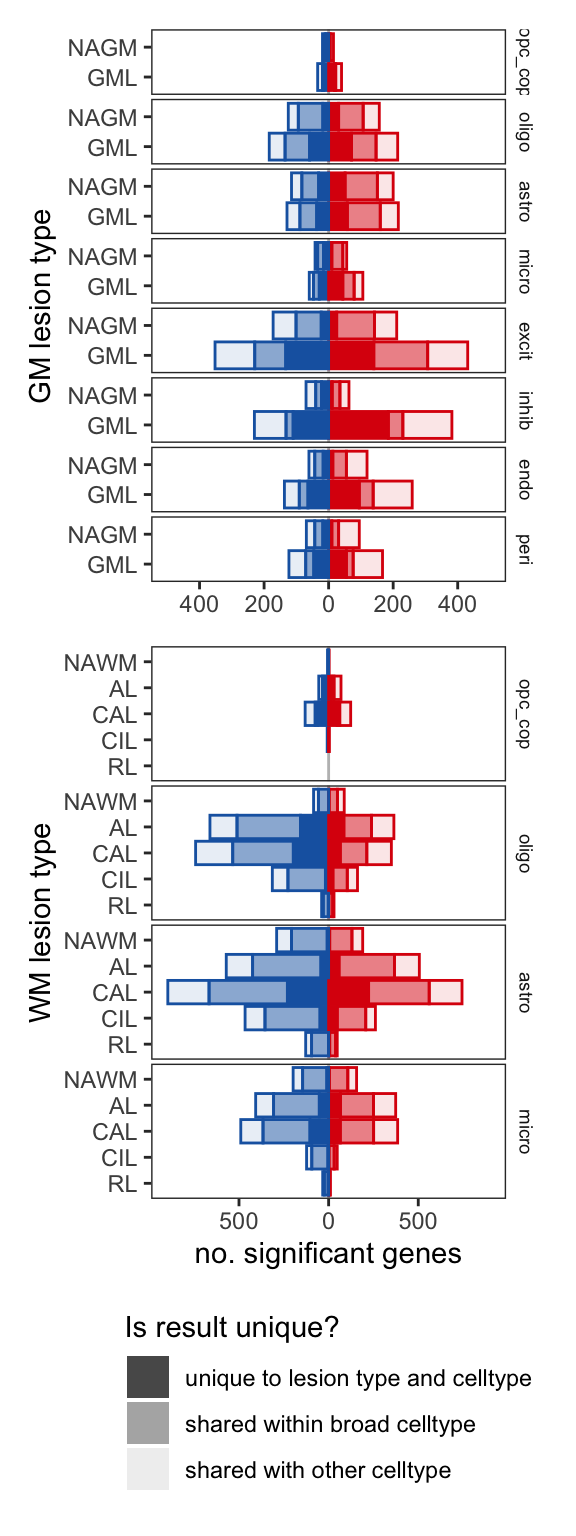
H
Dotplot of Hallmark module results for GM and WM.
include_graphics("figure/ms99_deg_figures_wm.Rmd/plot_gsea_dotplot_gm_wm-1.png", error = FALSE)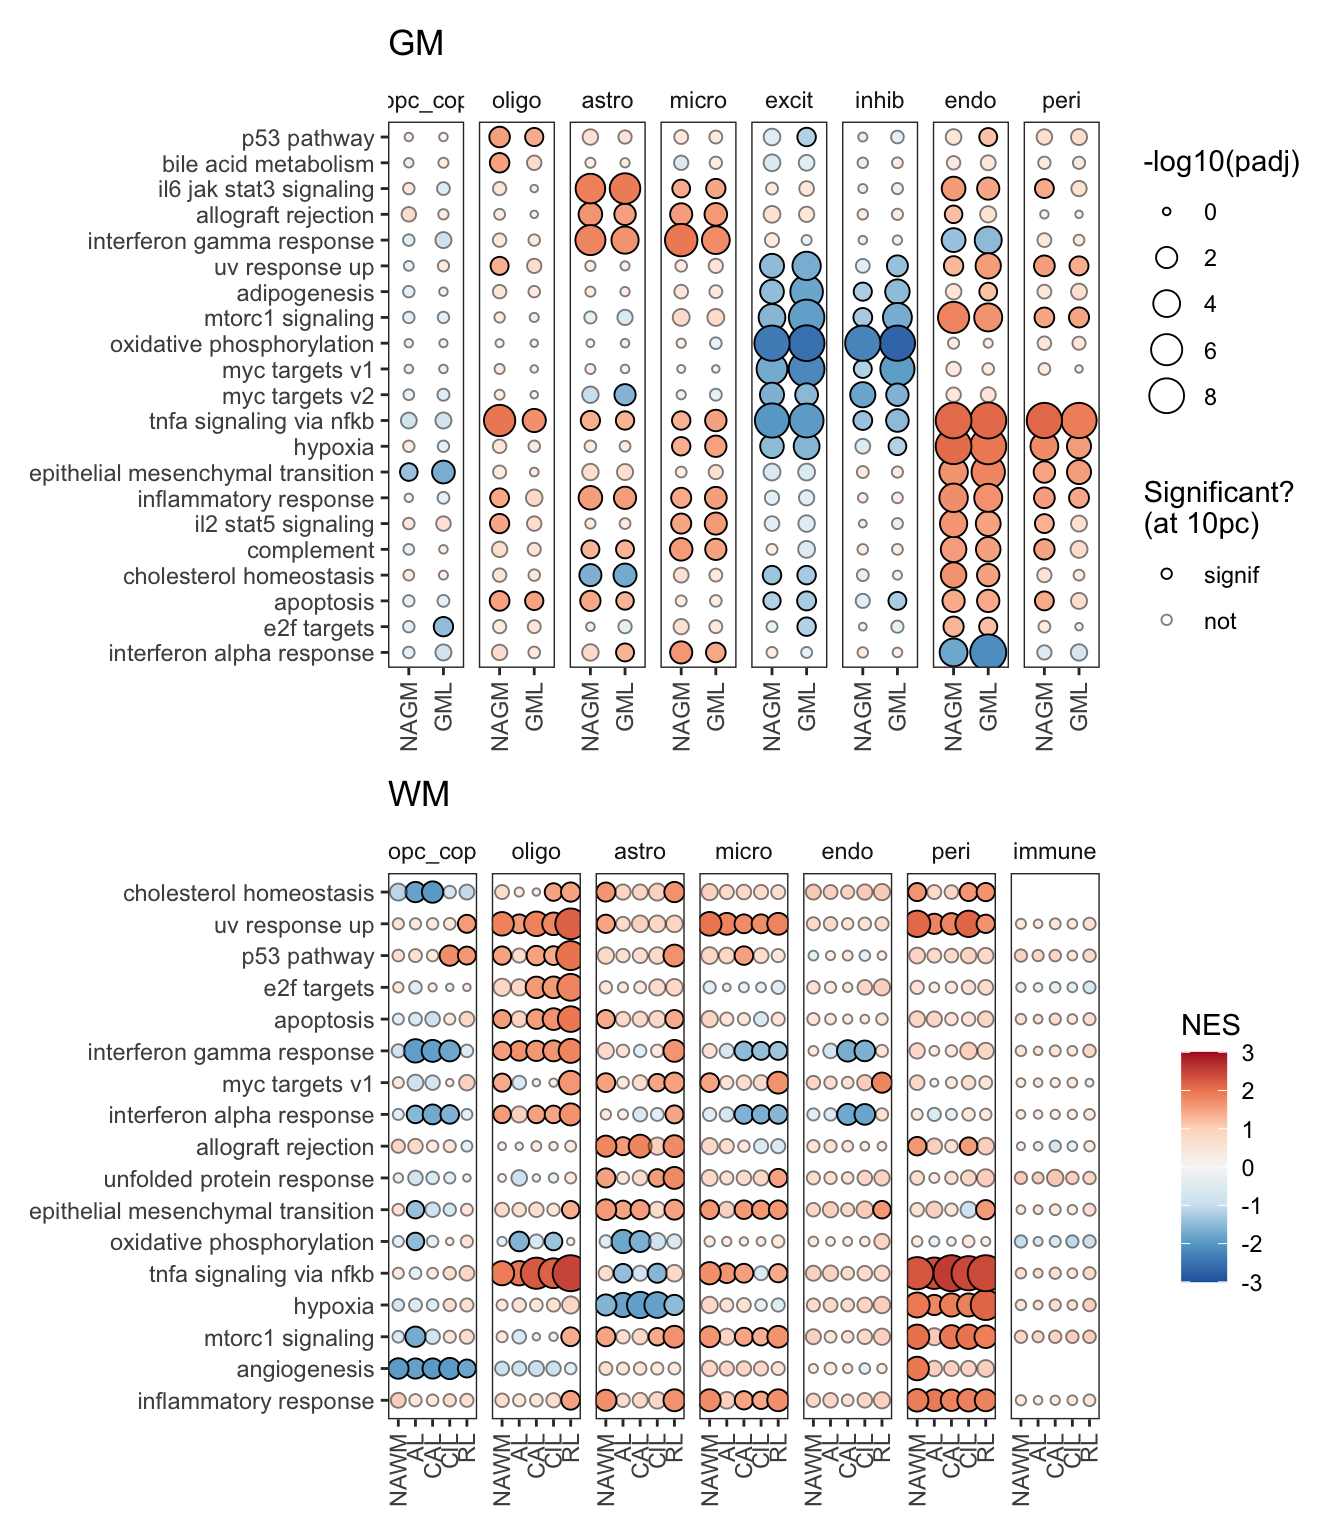
I
Heatmap of logFCs for selected genes significant in excitatory neurons.
include_graphics("figure/ms99_deg_figures_gm.Rmd/plot_heatmap_logfcs-1.png", error = FALSE)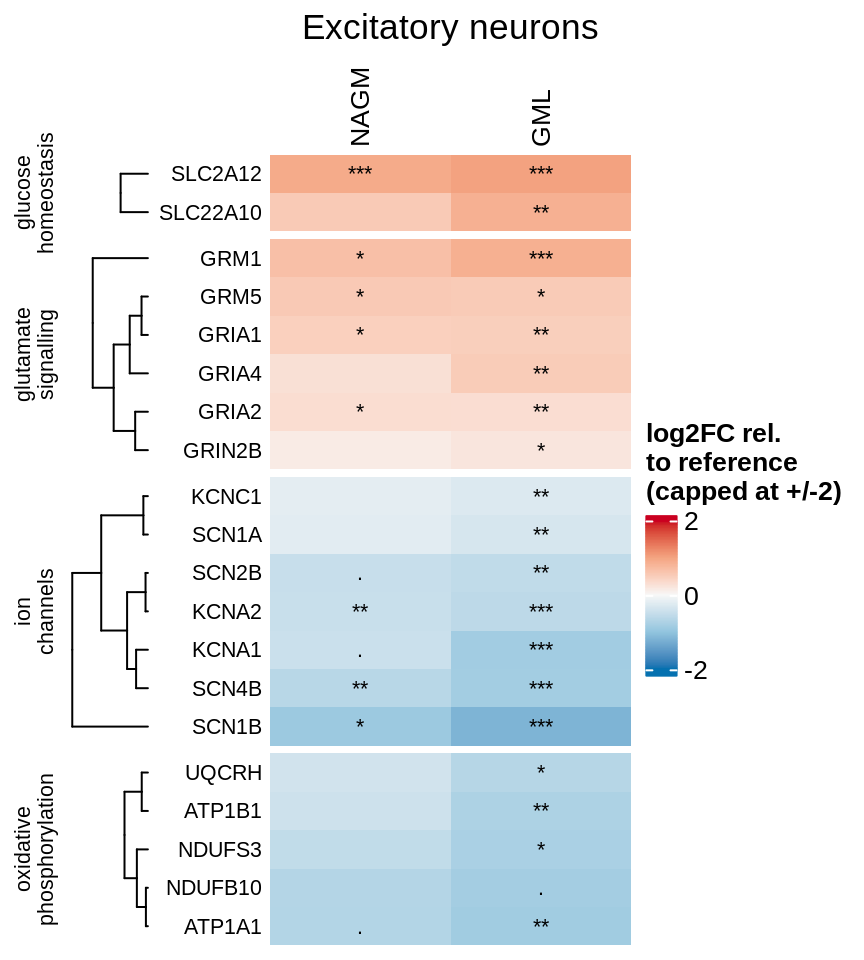
J
Heatmap of logFCs for interferon genes significant in oligodendroglia.
include_graphics("figure/ms99_deg_figures_wm.Rmd/plot_heatmap_logfcs-1.png", error = FALSE)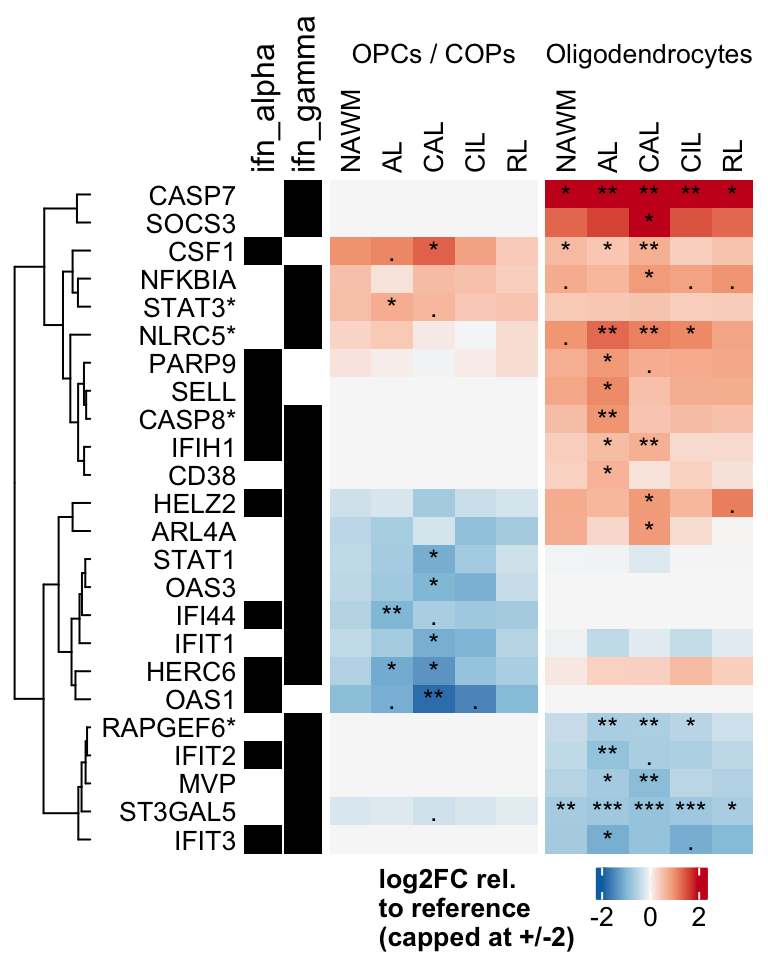
K
Genetic enrichment of differentially expressed genes.
include_graphics("figure/additional_figures/gwas_de_barplots.png", error = FALSE)
Figure 2
A
Clustering of WM fold change profiles. Restricted to genes where at least one lesion type has FDR < 5%. Clusters split so that average logFC difference between clusters is > log(4); clusters with fewer than 5 genes not shown; clusters ordered in descending order of mean logFC.
include_graphics("figure/ms99_deg_figures_wm.Rmd/plot_fc_cluster_profiles_sel-1.png", error = FALSE)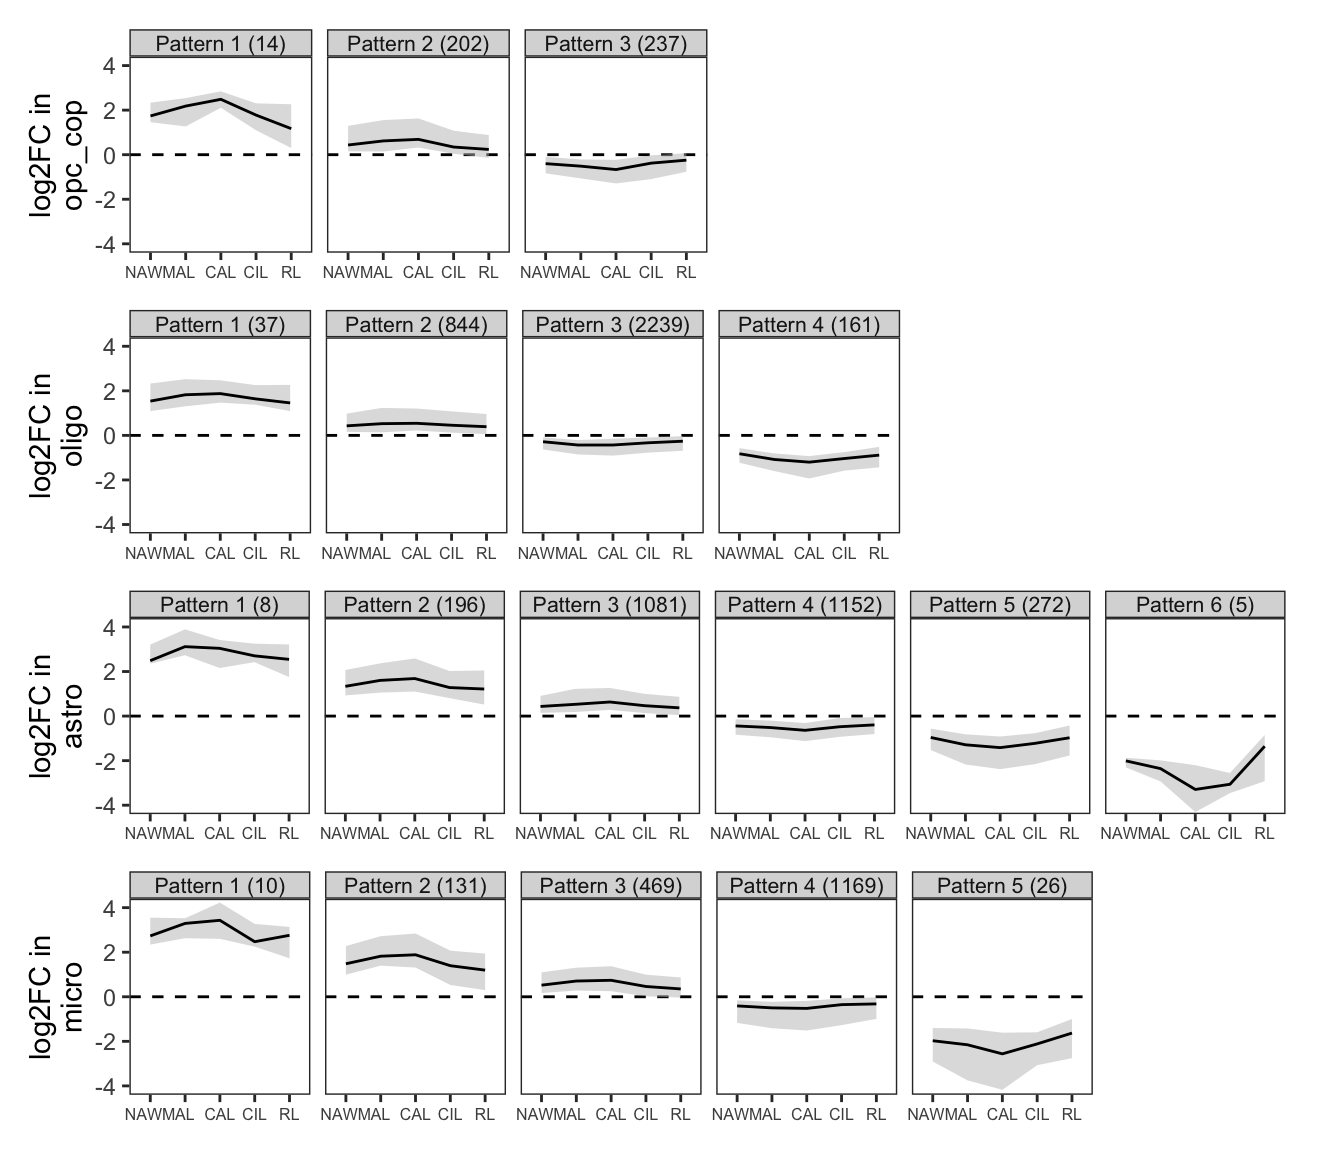
B
Expression heatmap of WM genes, ordered by lesion type.
include_graphics("figure/ms15_mofa_wm_edger_libs.Rmd/fig_overview_expression_narrow-2.png", error = FALSE)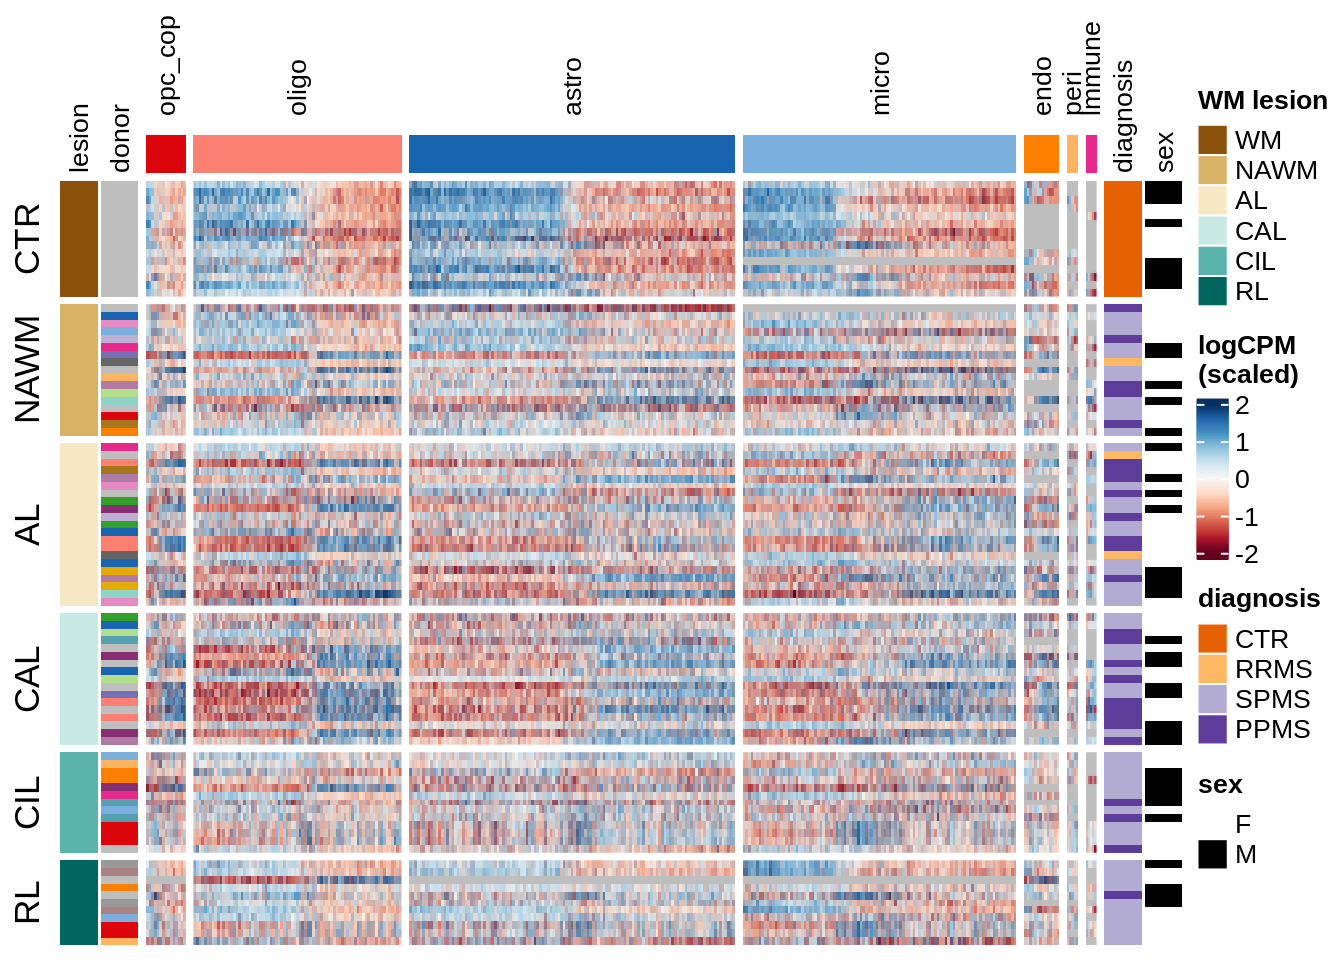
C
Expression heatmap of WM genes, ordered by hierarchical clustering.
include_graphics("figure/ms15_mofa_wm_edger_libs.Rmd/fig_overview_expression_narrow-1.png", error = FALSE)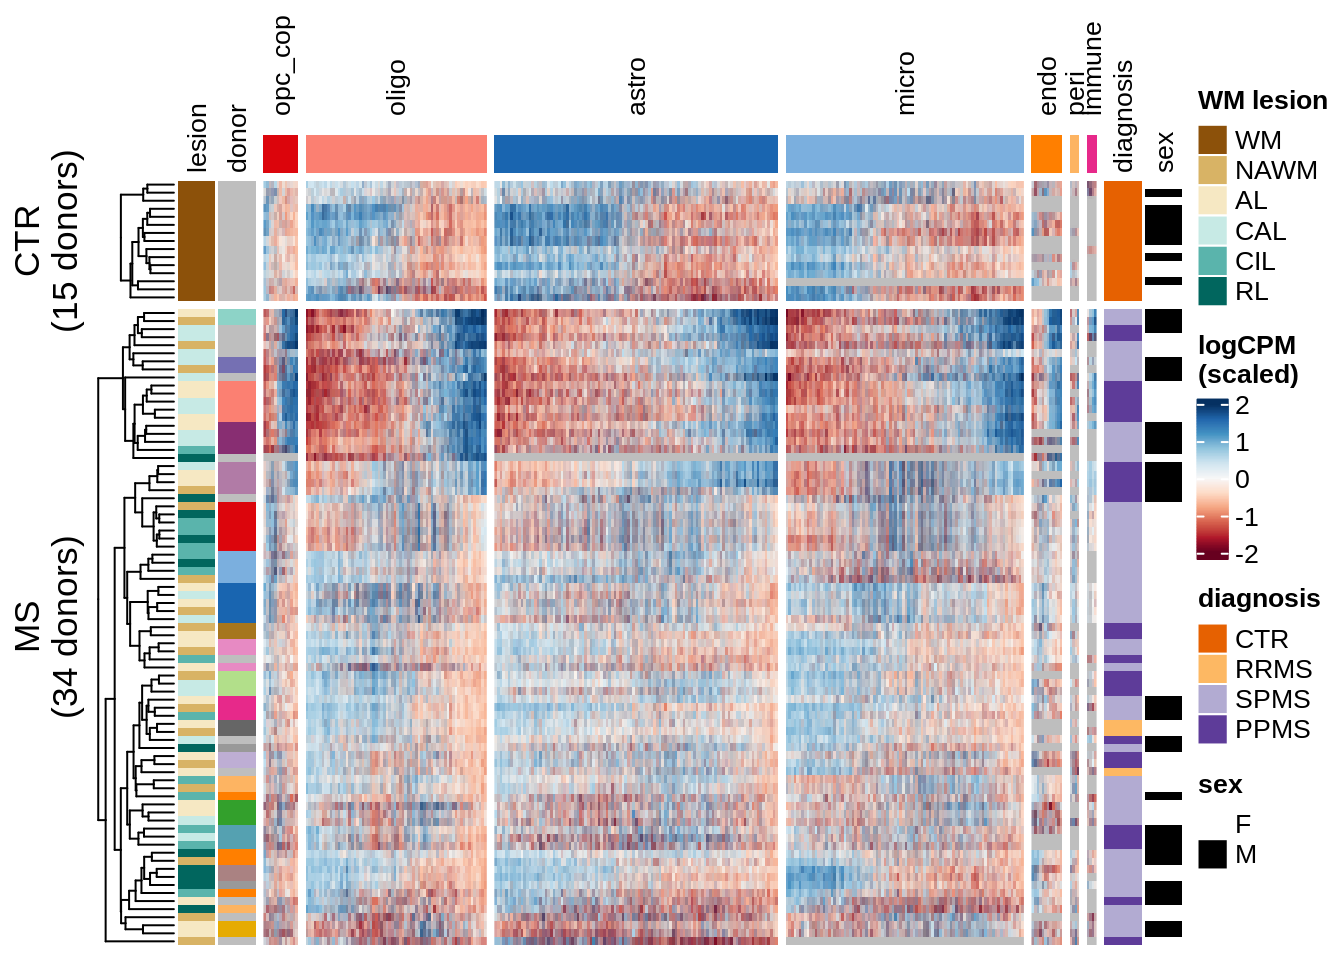
D
Expression heatmap of GM genes, ordered by lesion type.
include_graphics("figure/ms15_mofa_gm_edger_libs.Rmd/fig_overview_expression_narrow-1.png", error = FALSE)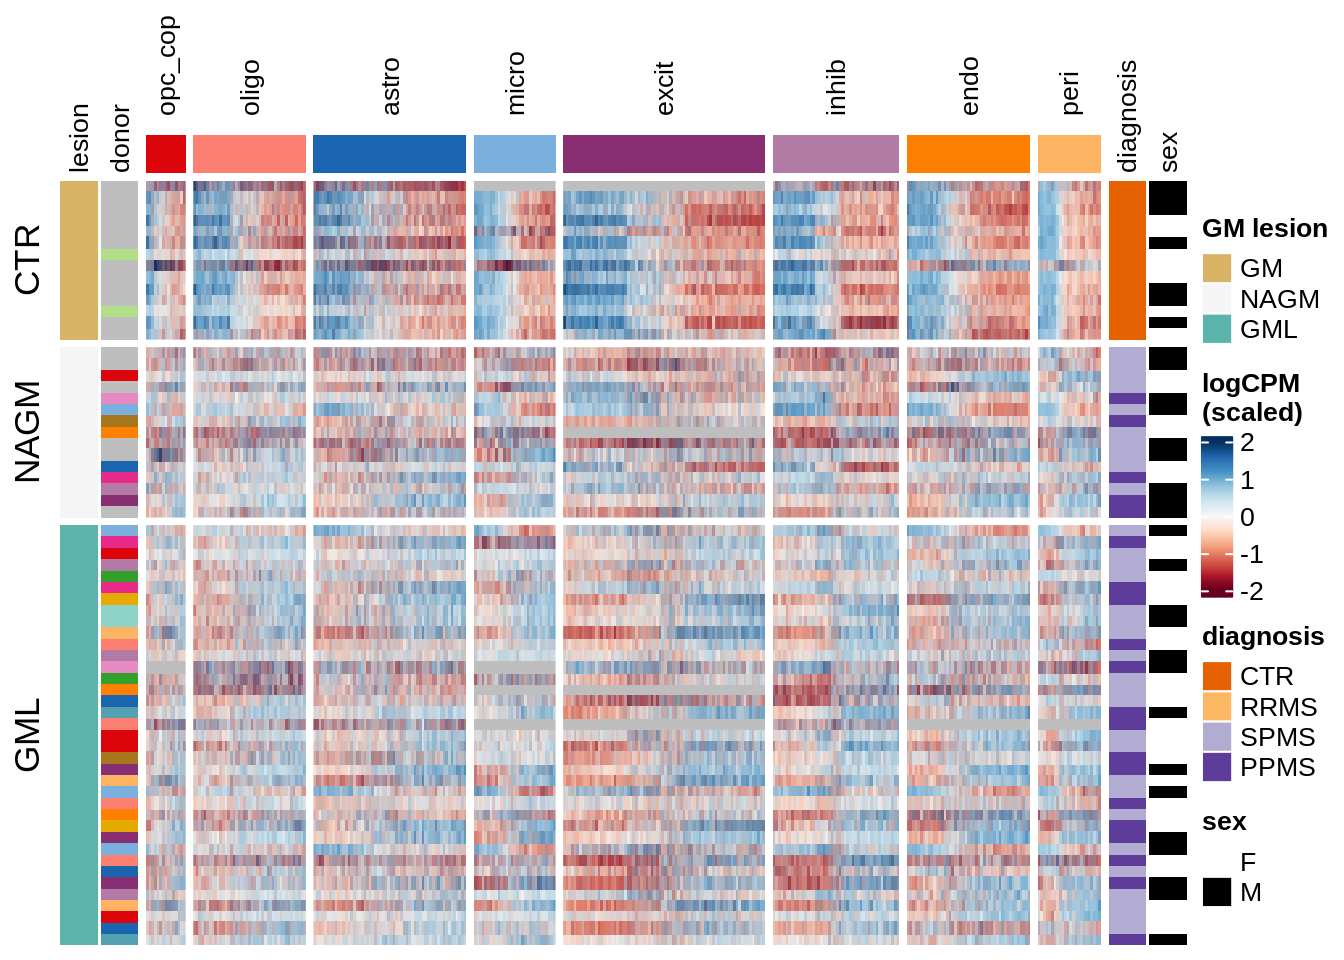
| Version | Author | Date |
|---|---|---|
| 7f9bc30 | Macnair | 2022-04-05 |
E
Expression heatmap of GM genes, ordered by hierarchical clustering.
include_graphics("figure/ms15_mofa_gm_edger_libs.Rmd/fig_overview_expression_narrow-2.png", error = FALSE)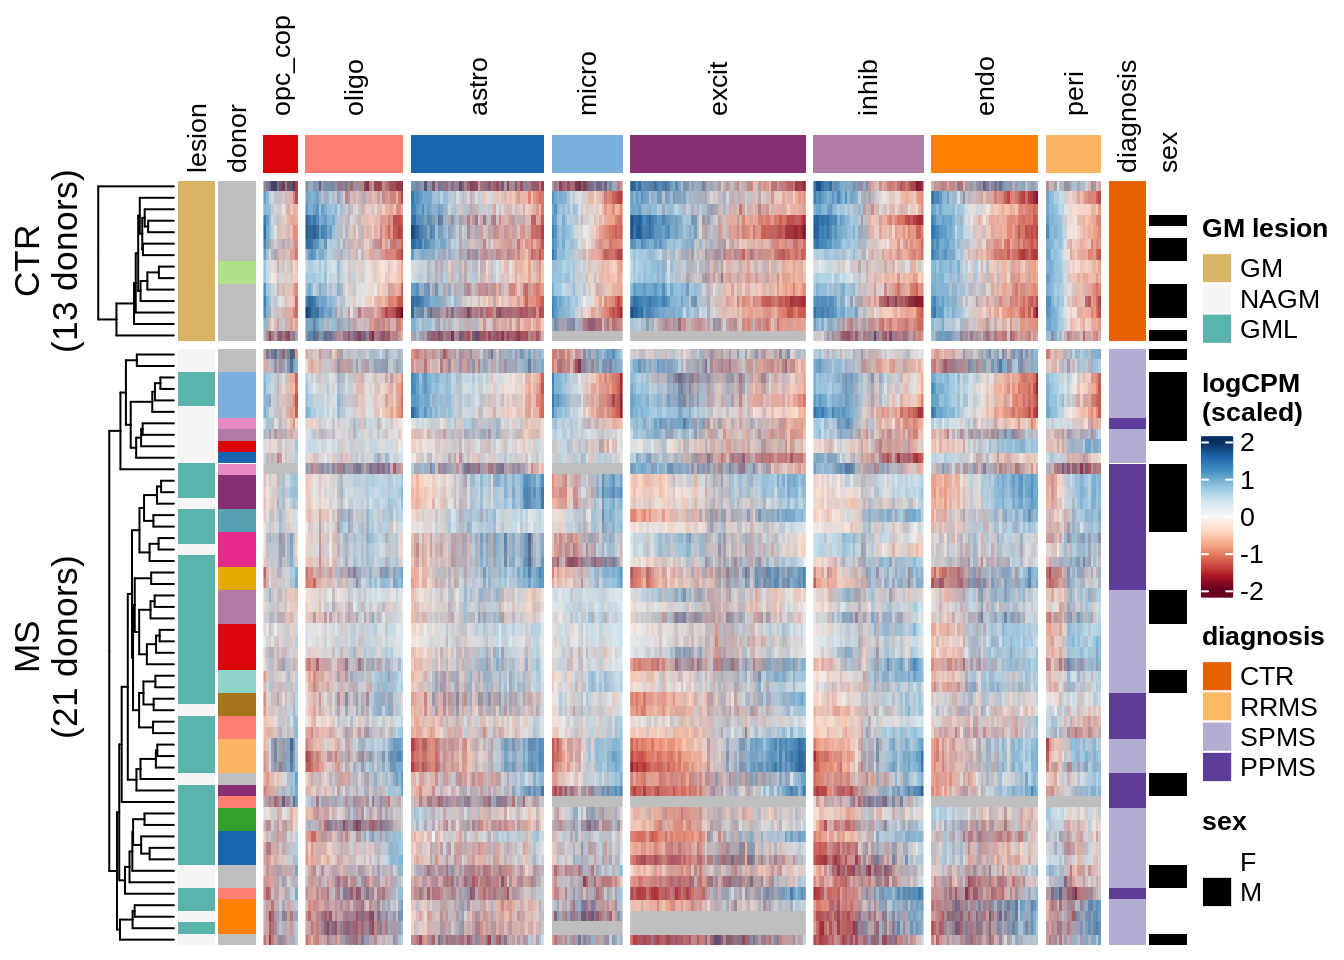
| Version | Author | Date |
|---|---|---|
| 7f9bc30 | Macnair | 2022-04-05 |
Figure 3
A
Proportions of fine celltypes in healthy GM and healthy WM. Neuronal celltypes excluded. Negative binomial model fit to absolute numbers for each celltype, using total number of cells in sample as offset. FDR calculated across all celltypes.
include_graphics("figure/ms09_ancombc_mixed.Rmd/plot_wm_vs_gm-1.png", error = FALSE)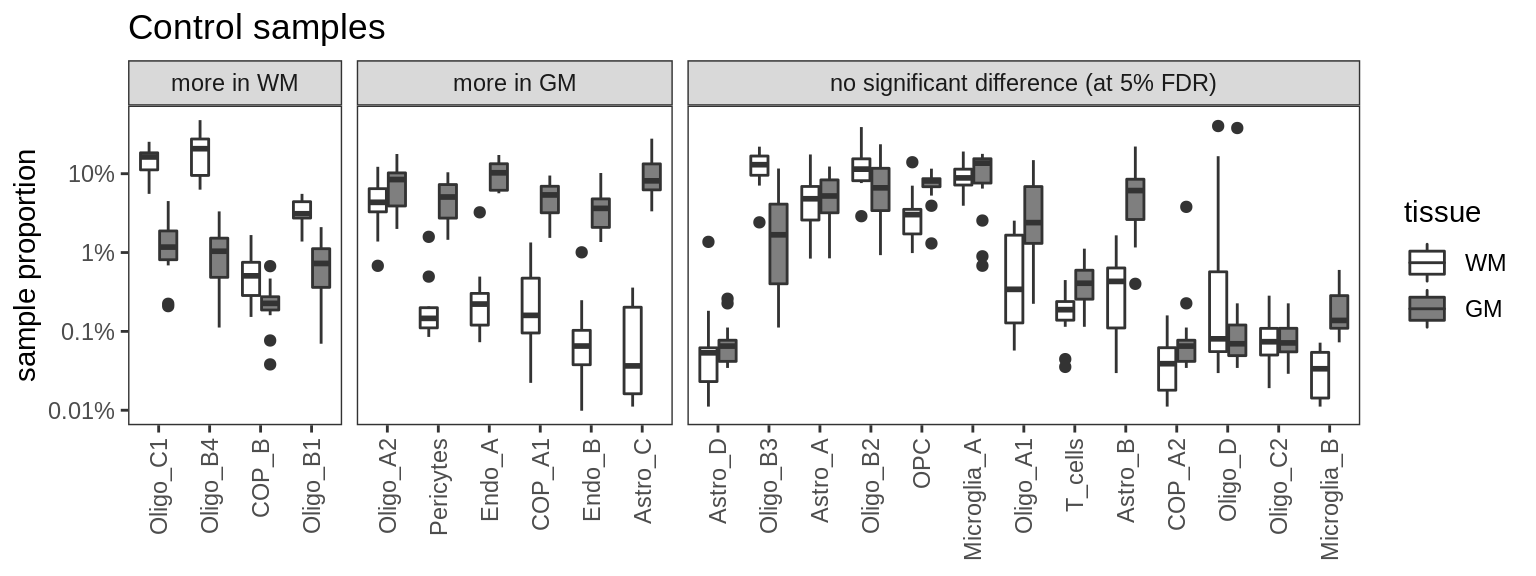
B
Median oNMF module score per fine celltype for astrocyte modules and cells. Columns are scaled to have max value equal to 1.
include_graphics("figure/ms08_modules.Rmd/plot_scores_by_type_scaled-5.png", error = FALSE)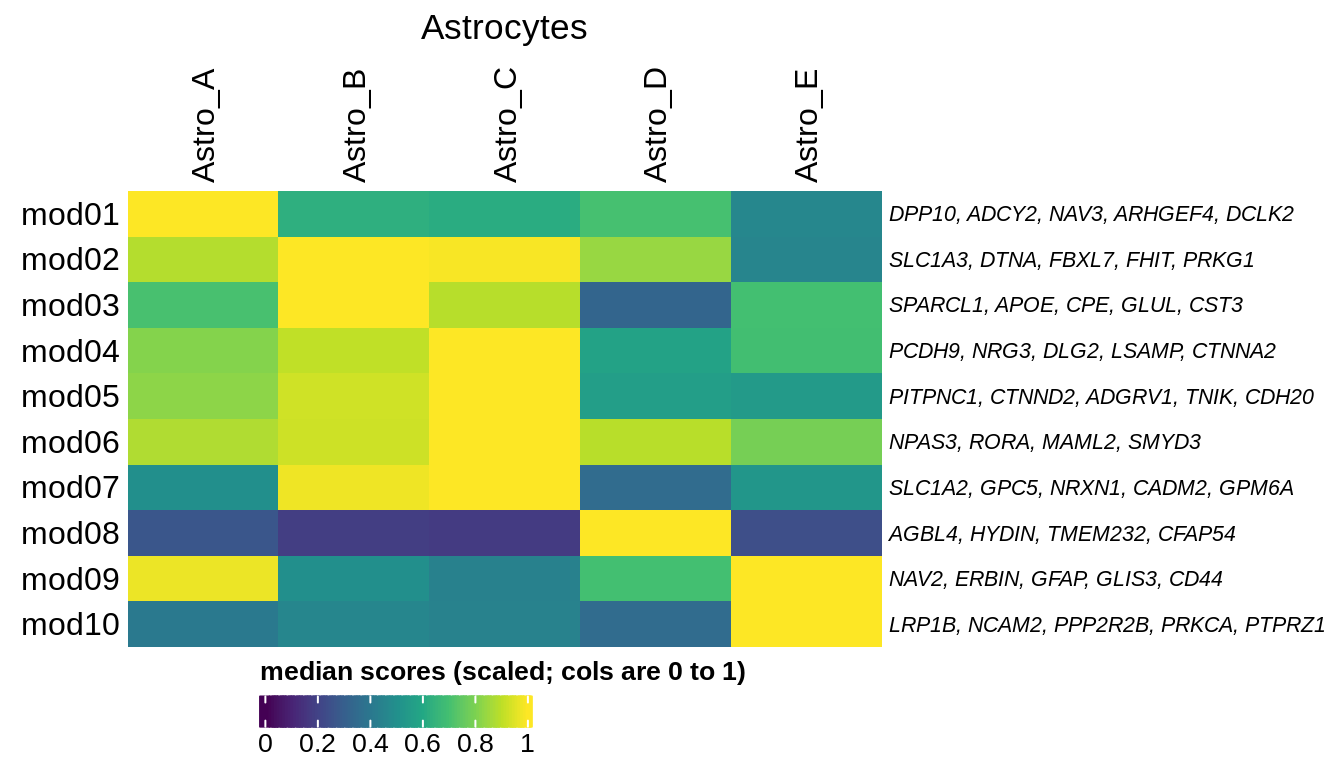
C
Contribution to variability in celltype abundances explained by lesion + patient in WM.
include_graphics("figure/ms09_ancombc_mixed.Rmd/plot_lrt_results-1.png", error = FALSE)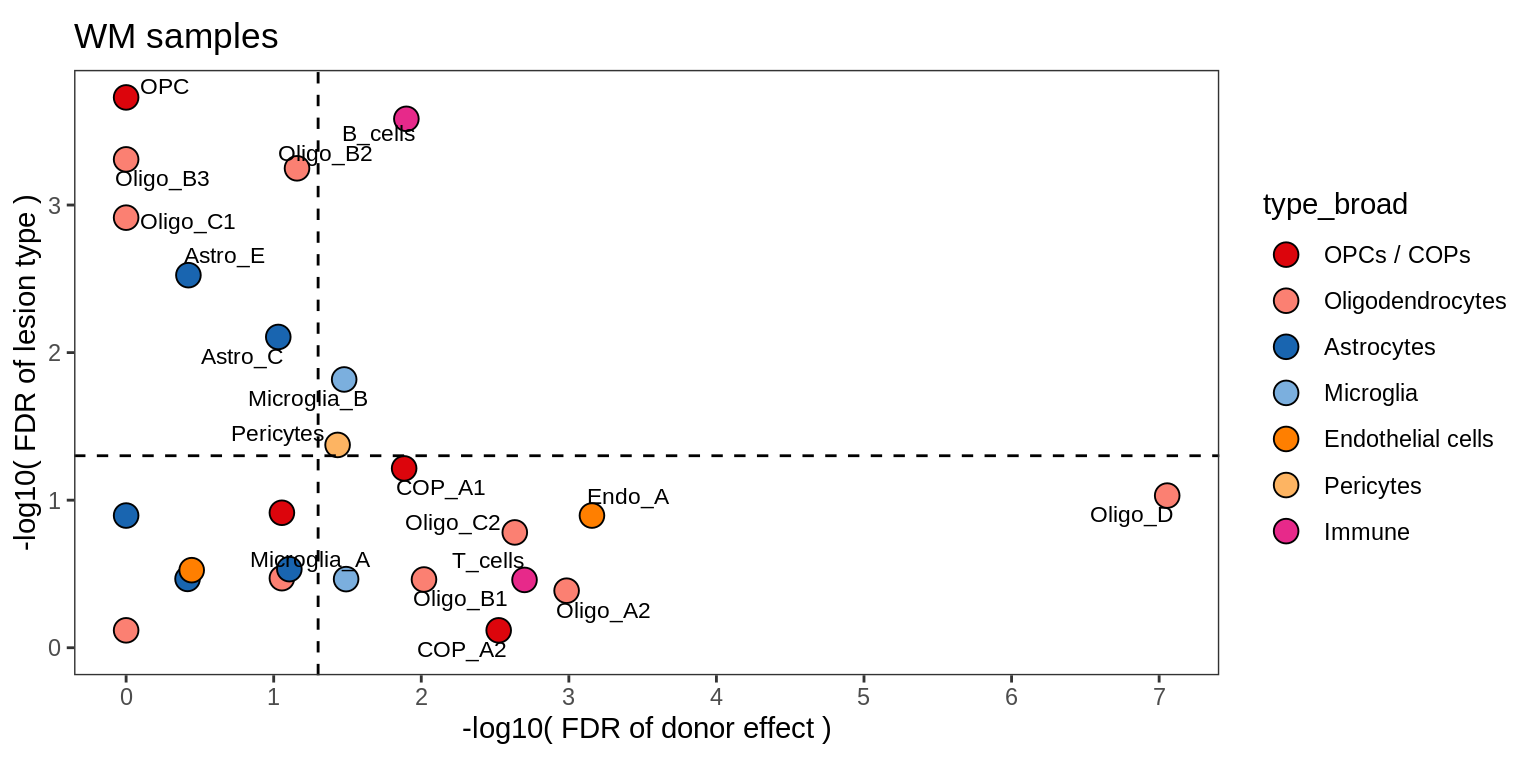
D
Contribution to variability in celltype abundances explained by lesion + patient in GM, including 4 layer PCs.
# include_graphics("figure/ms09_ancombc_mixed.Rmd/plot_lrt_results-2.png", error = FALSE)
include_graphics("figure/ms09_ancombc_mixed.Rmd/plot_lrt_results-6.png", error = FALSE)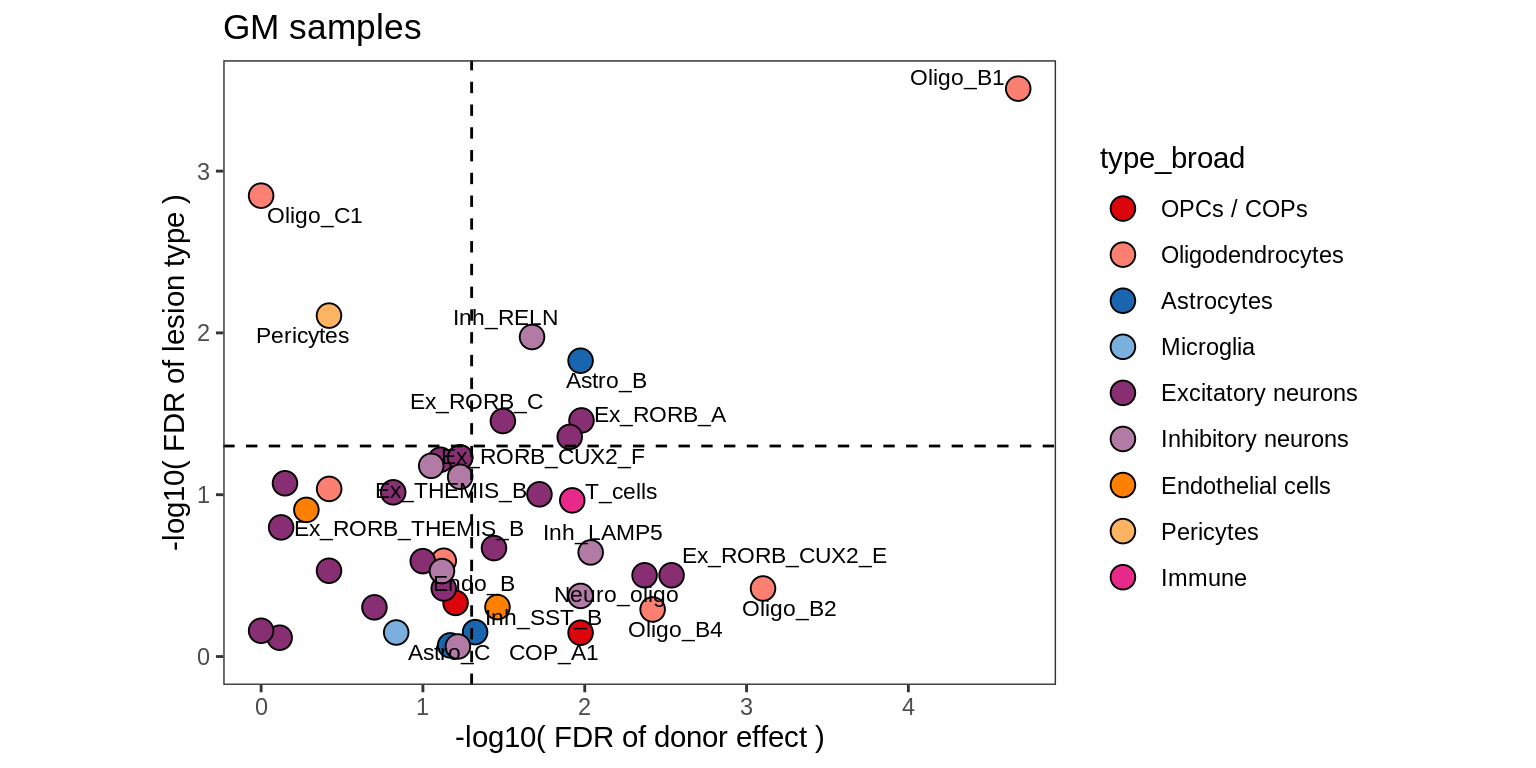
E
Differential abundance results for WM.
include_graphics("figure/ms09_ancombc_mixed.Rmd/plot_bootstraps_lesions_signif-1.png", error = FALSE)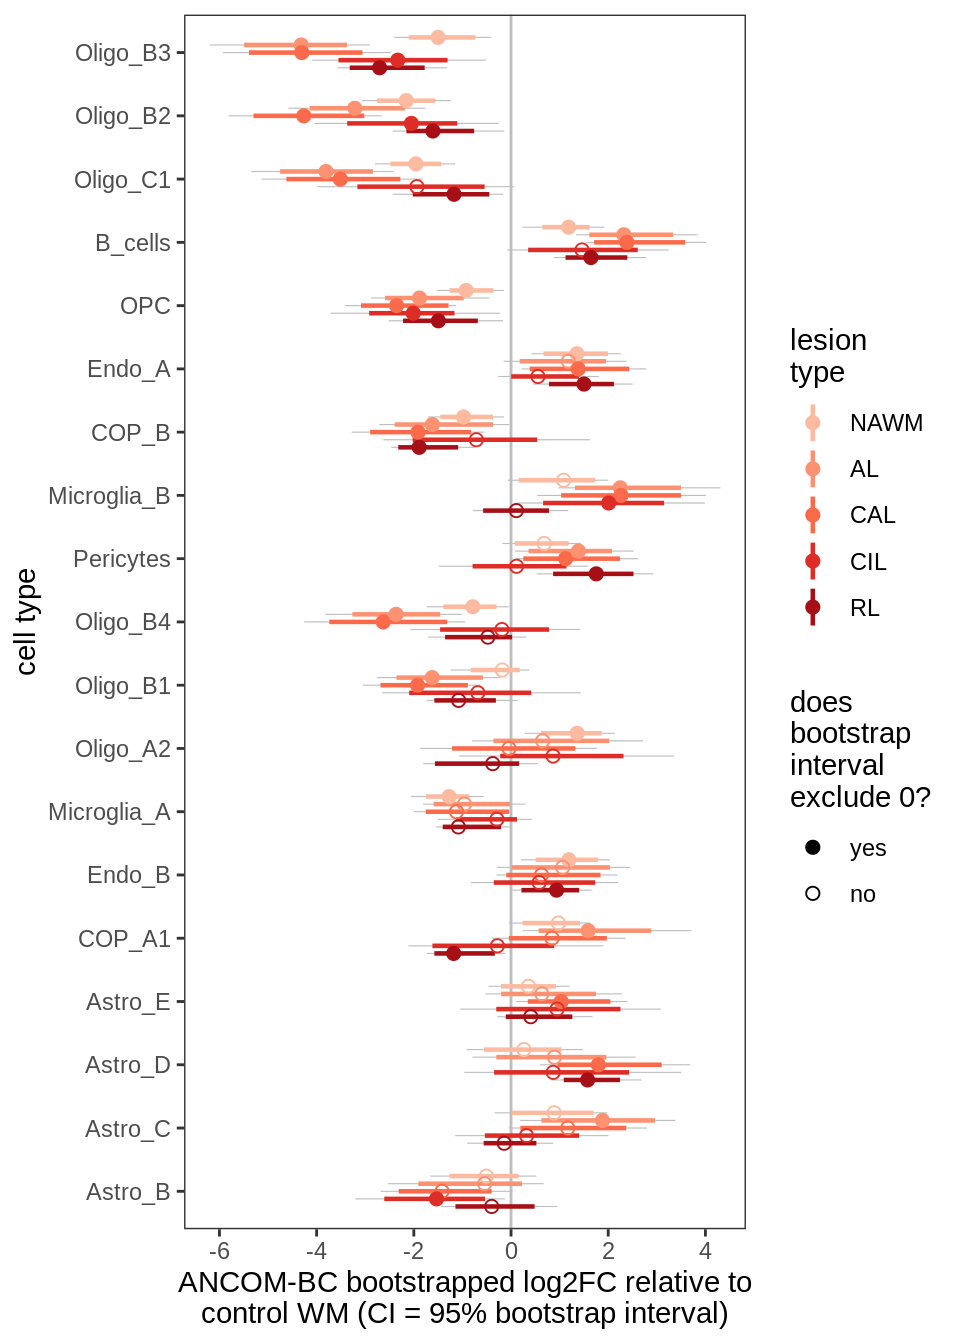
F
Differential abundance results for GM (with layers factored out).
include_graphics("figure/ms09_ancombc_mixed.Rmd/plot_bootstraps_lesions_signif-6.png", error = FALSE)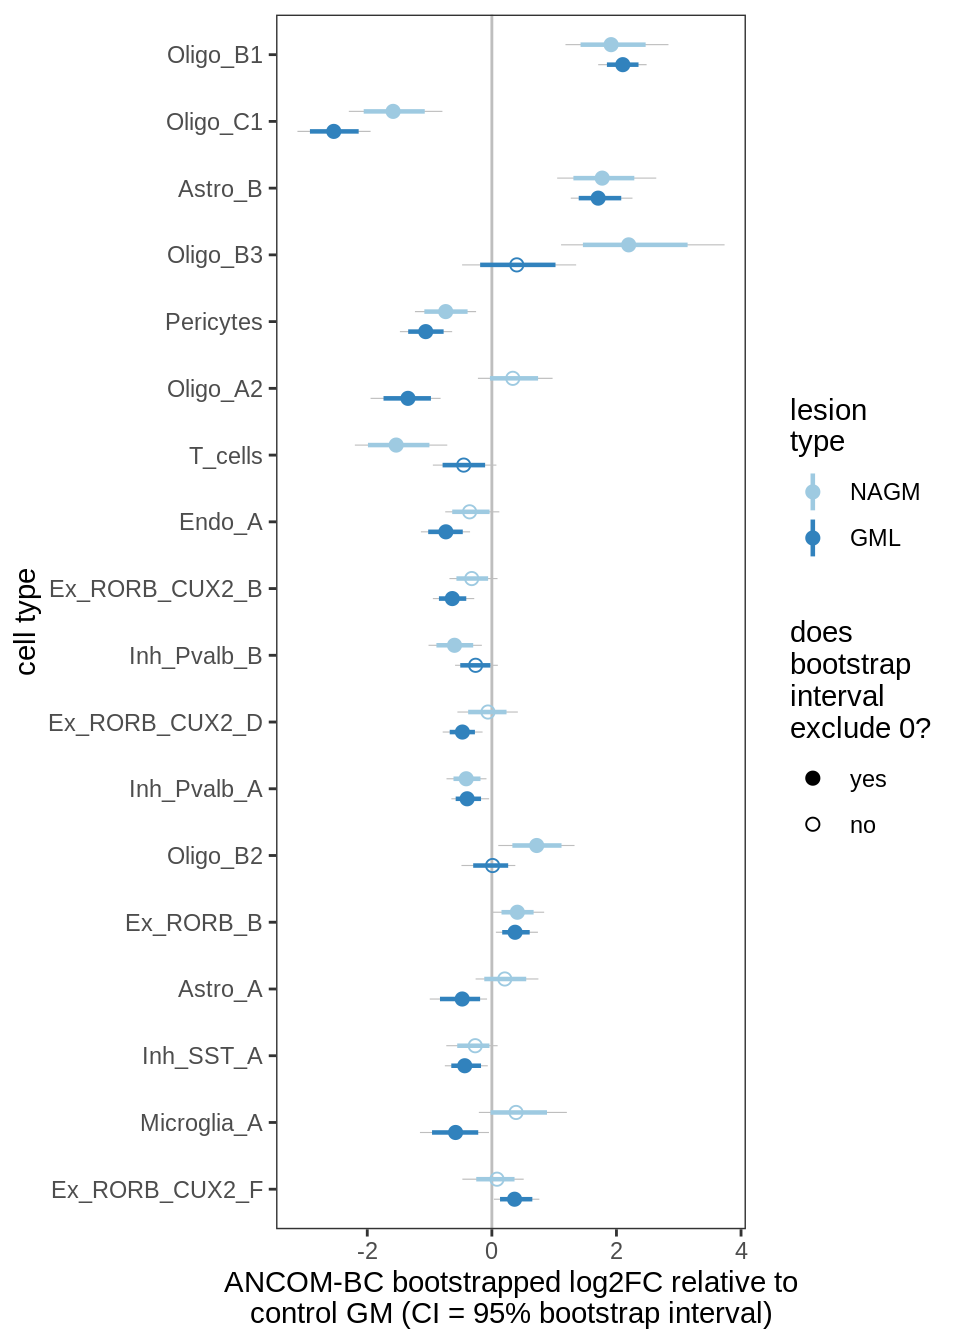
G
Validation of GPR17+ cell abundances by IHC staining.
include_graphics("figure/ms09_ancombc_mixed.Rmd/plot_no_gpr17_cells-1.png", error = FALSE)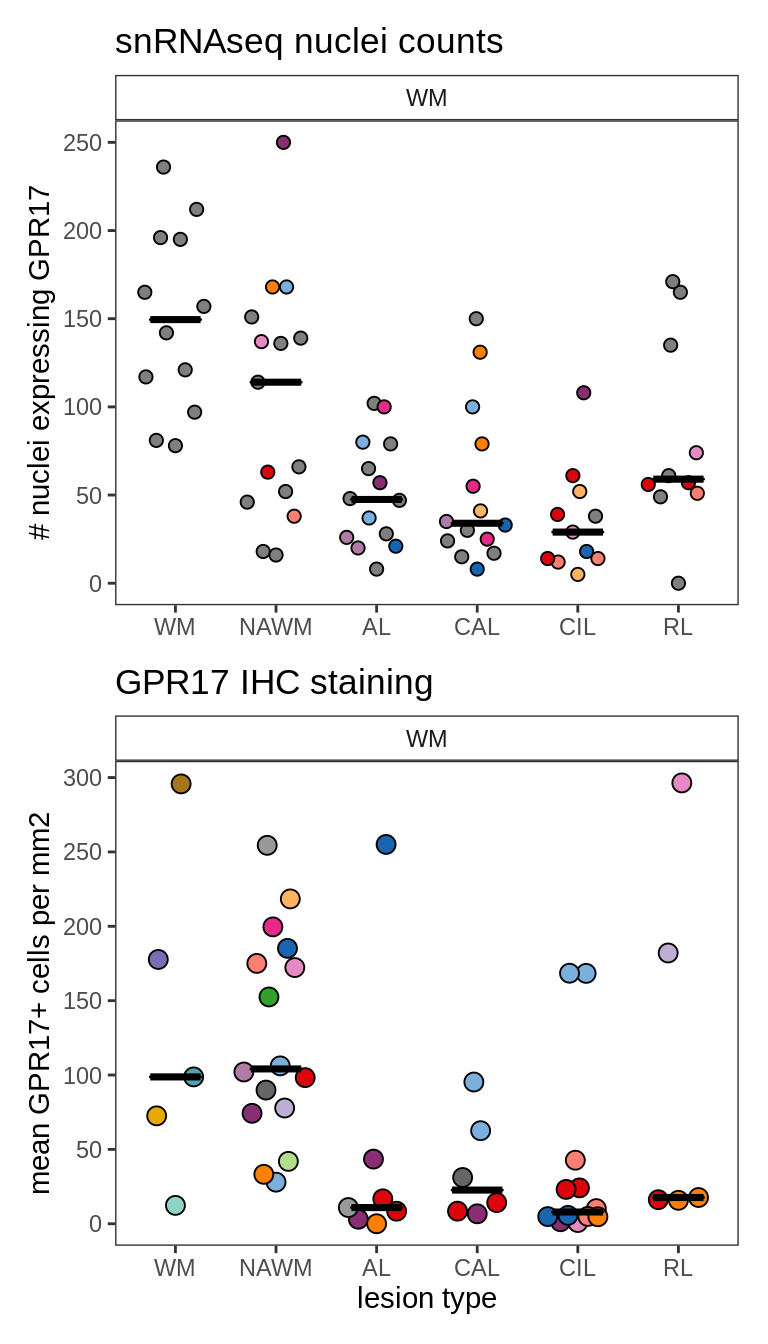
Figure 4
A
Patient stratification via MOFA factors.
include_graphics("figure/ms15_mofa_wm_edger_libs.Rmd/plot_factors_heatmap_few-1.png", error = FALSE)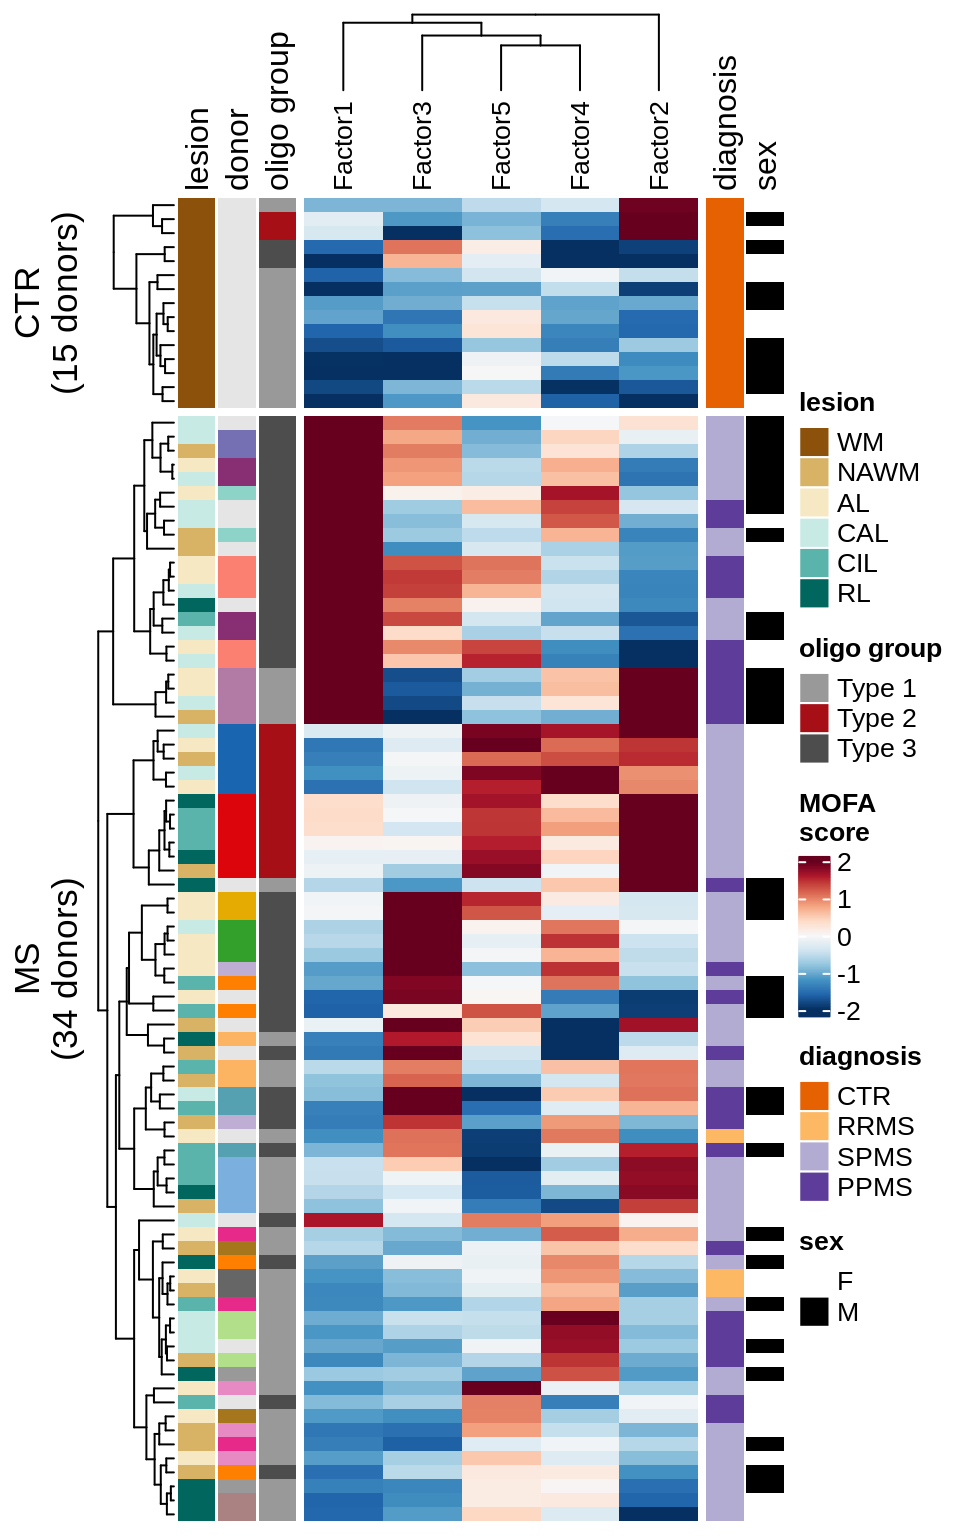
B
Factor 1 top genes
include_graphics("figure/ms15_mofa_wm_edger_libs.Rmd/fig_factor1-1.png", error = FALSE)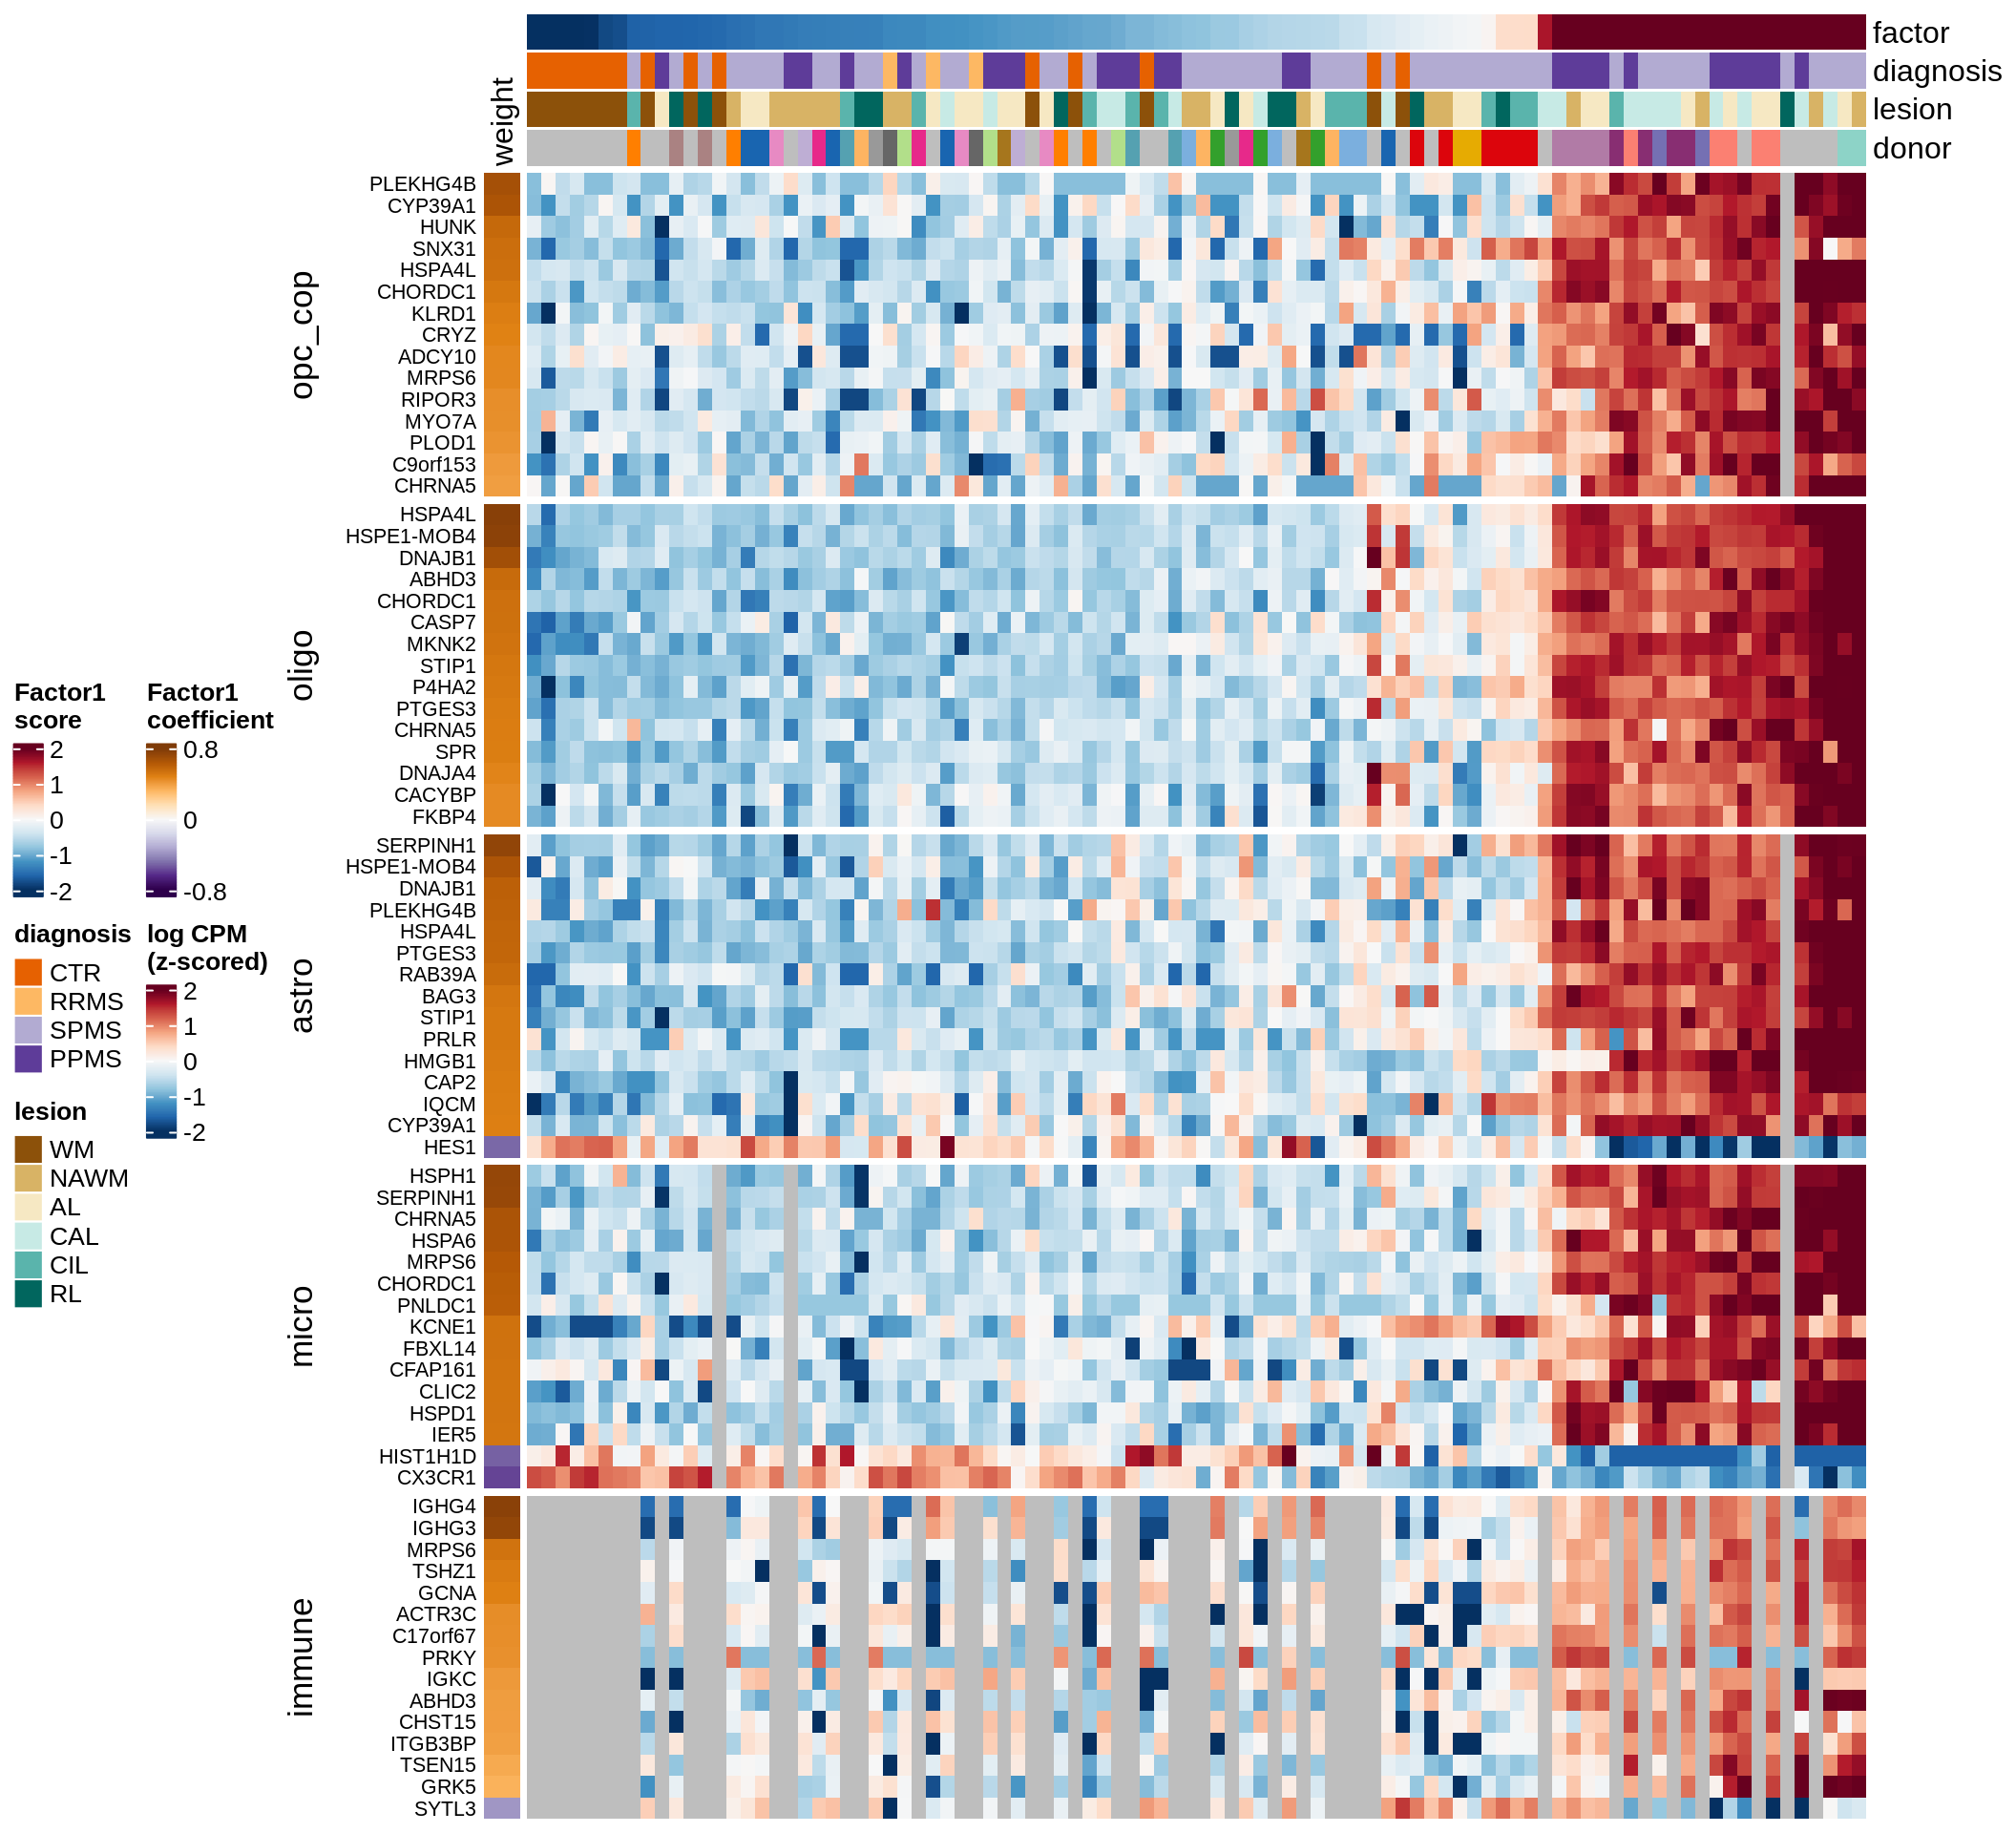
C
Factor 3 top genes
include_graphics("figure/ms15_mofa_wm_edger_libs.Rmd/fig_factor3-1.png", error = FALSE)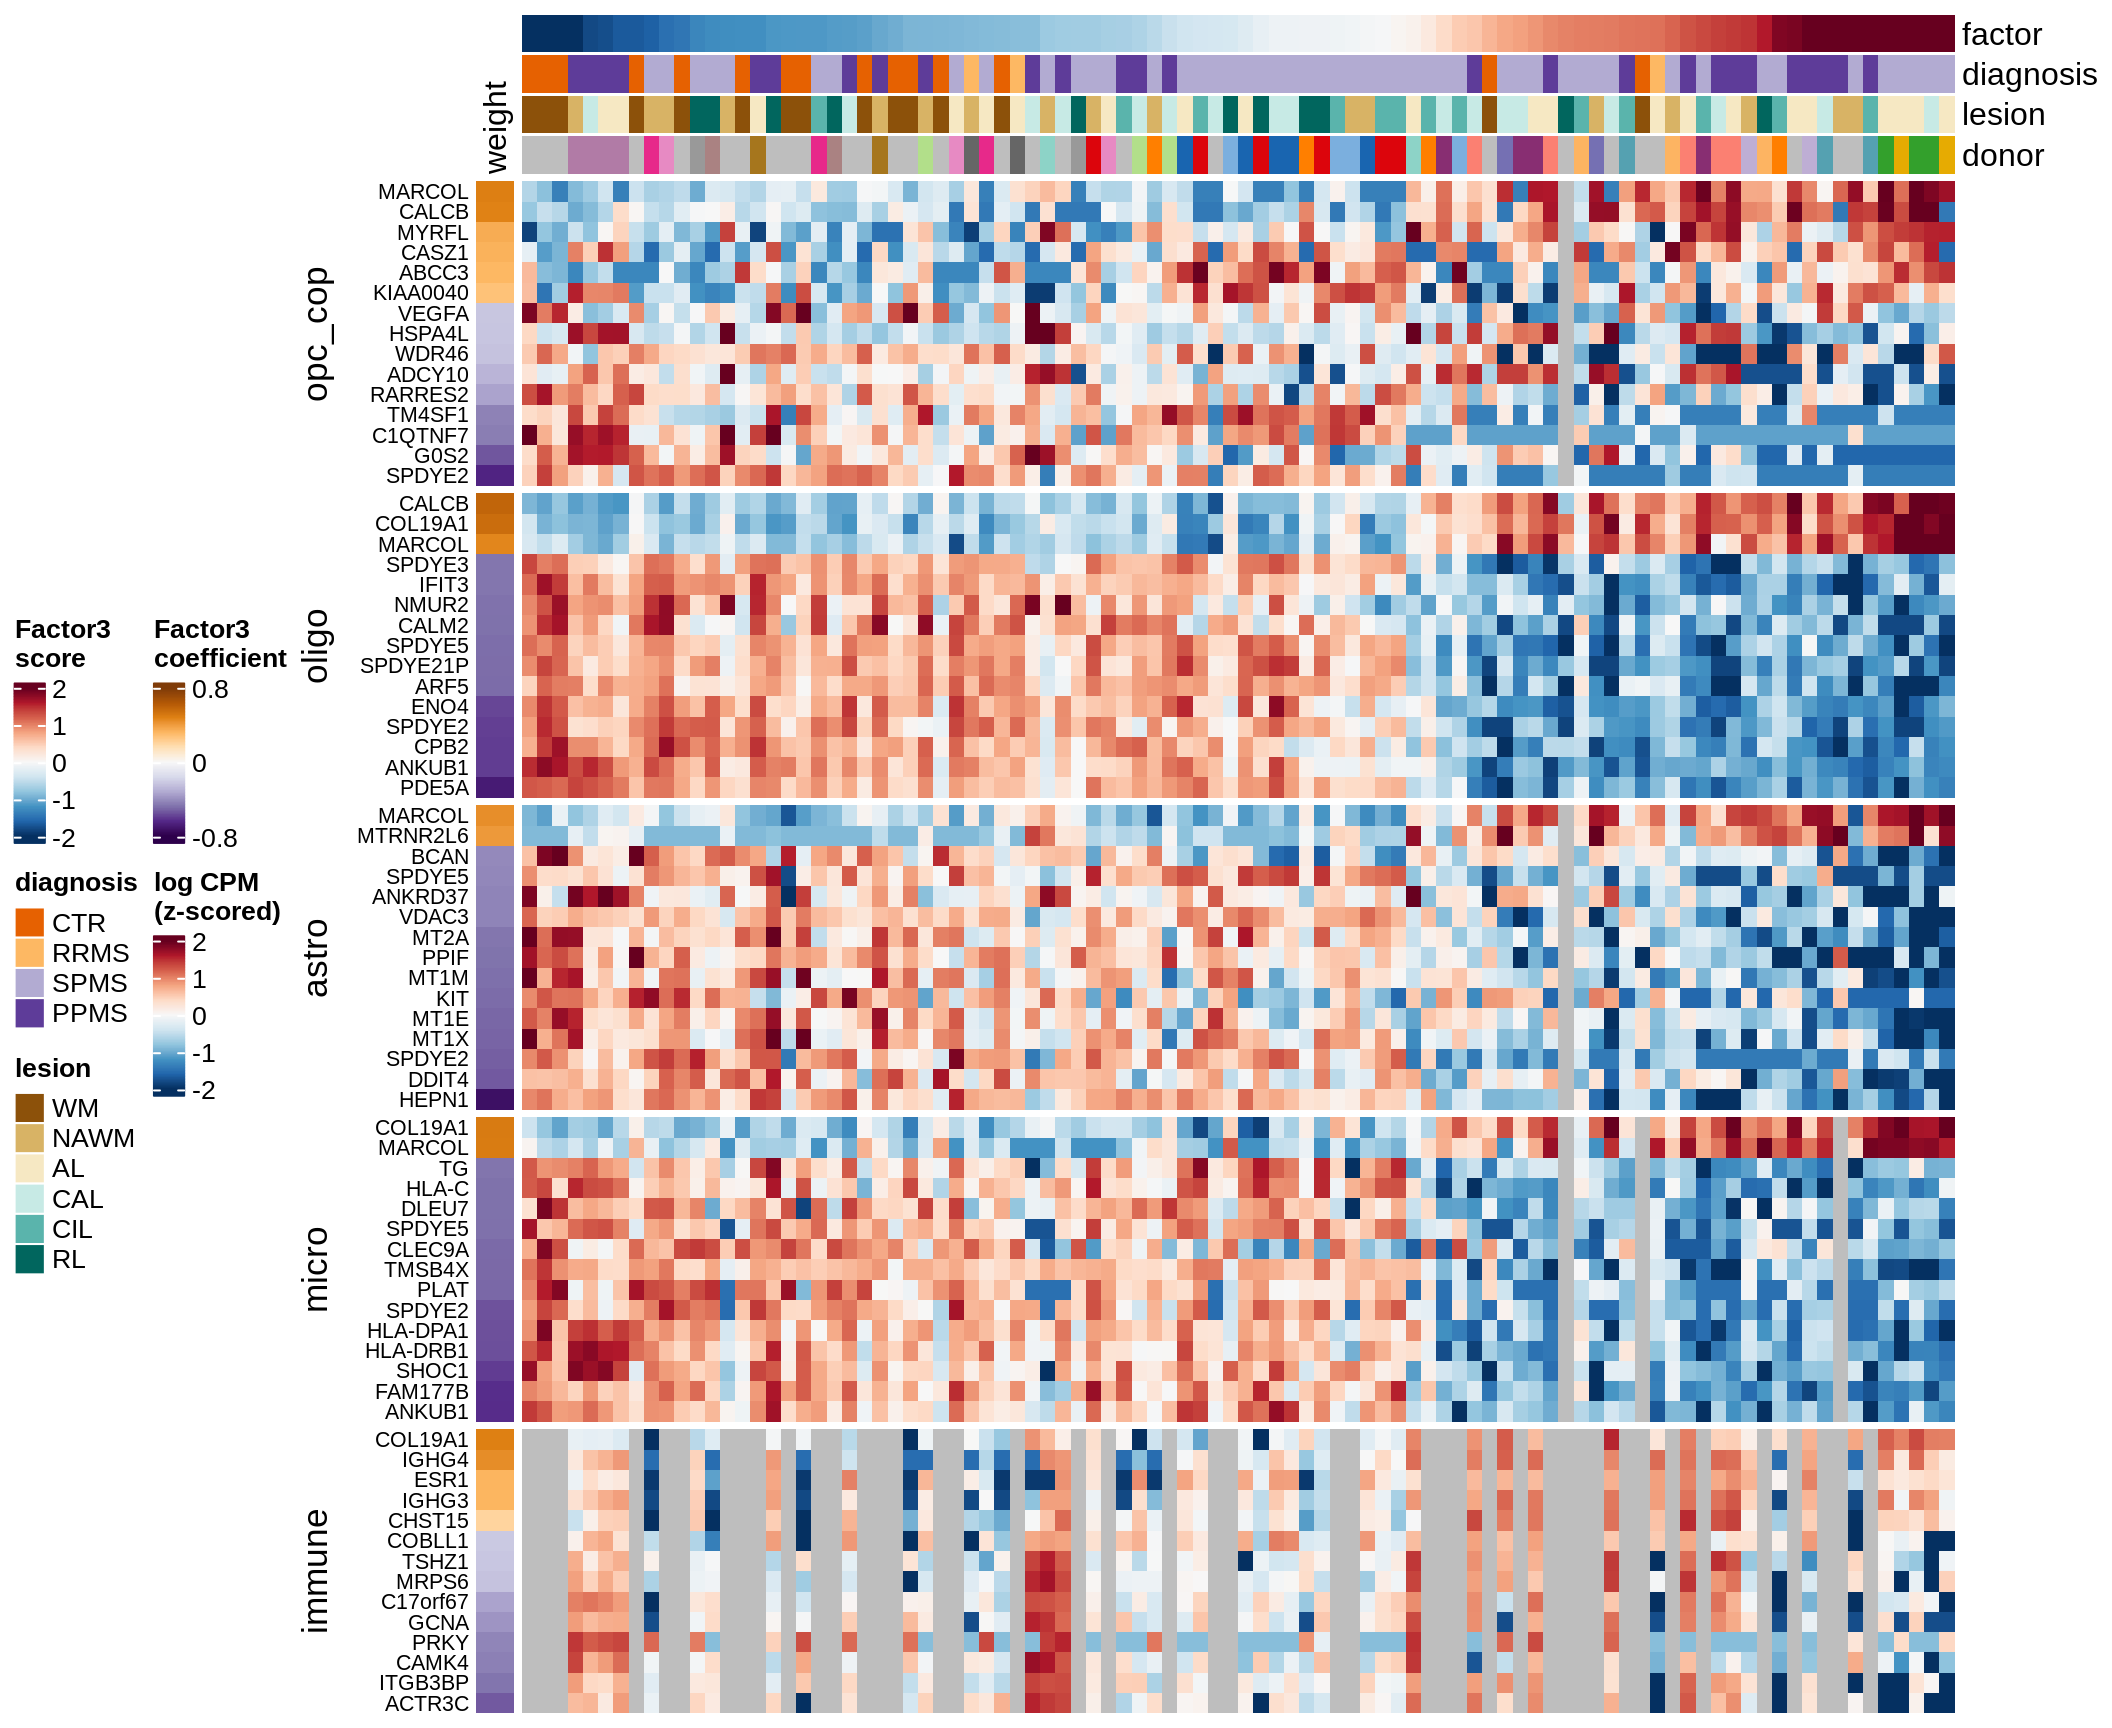
D
Factor 5 top genes
include_graphics("figure/ms15_mofa_wm_edger_libs.Rmd/fig_factor5-1.png", error = FALSE)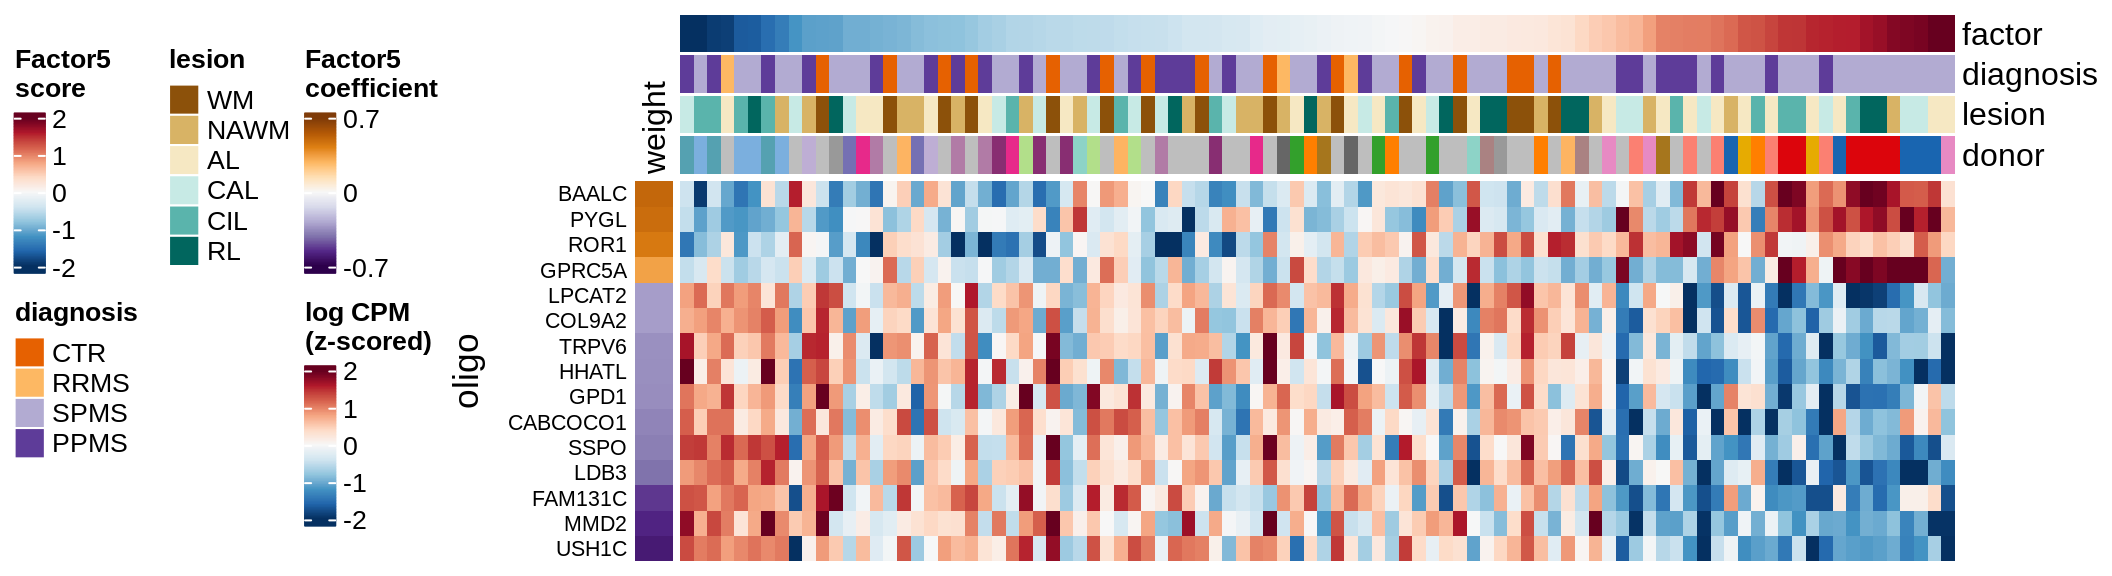
E
WM oligodendroglia proportions barplot
include_graphics("figure/ms09_ancombc_mixed.Rmd/plot_sample_splits_bars_oligos-1.png", error = FALSE)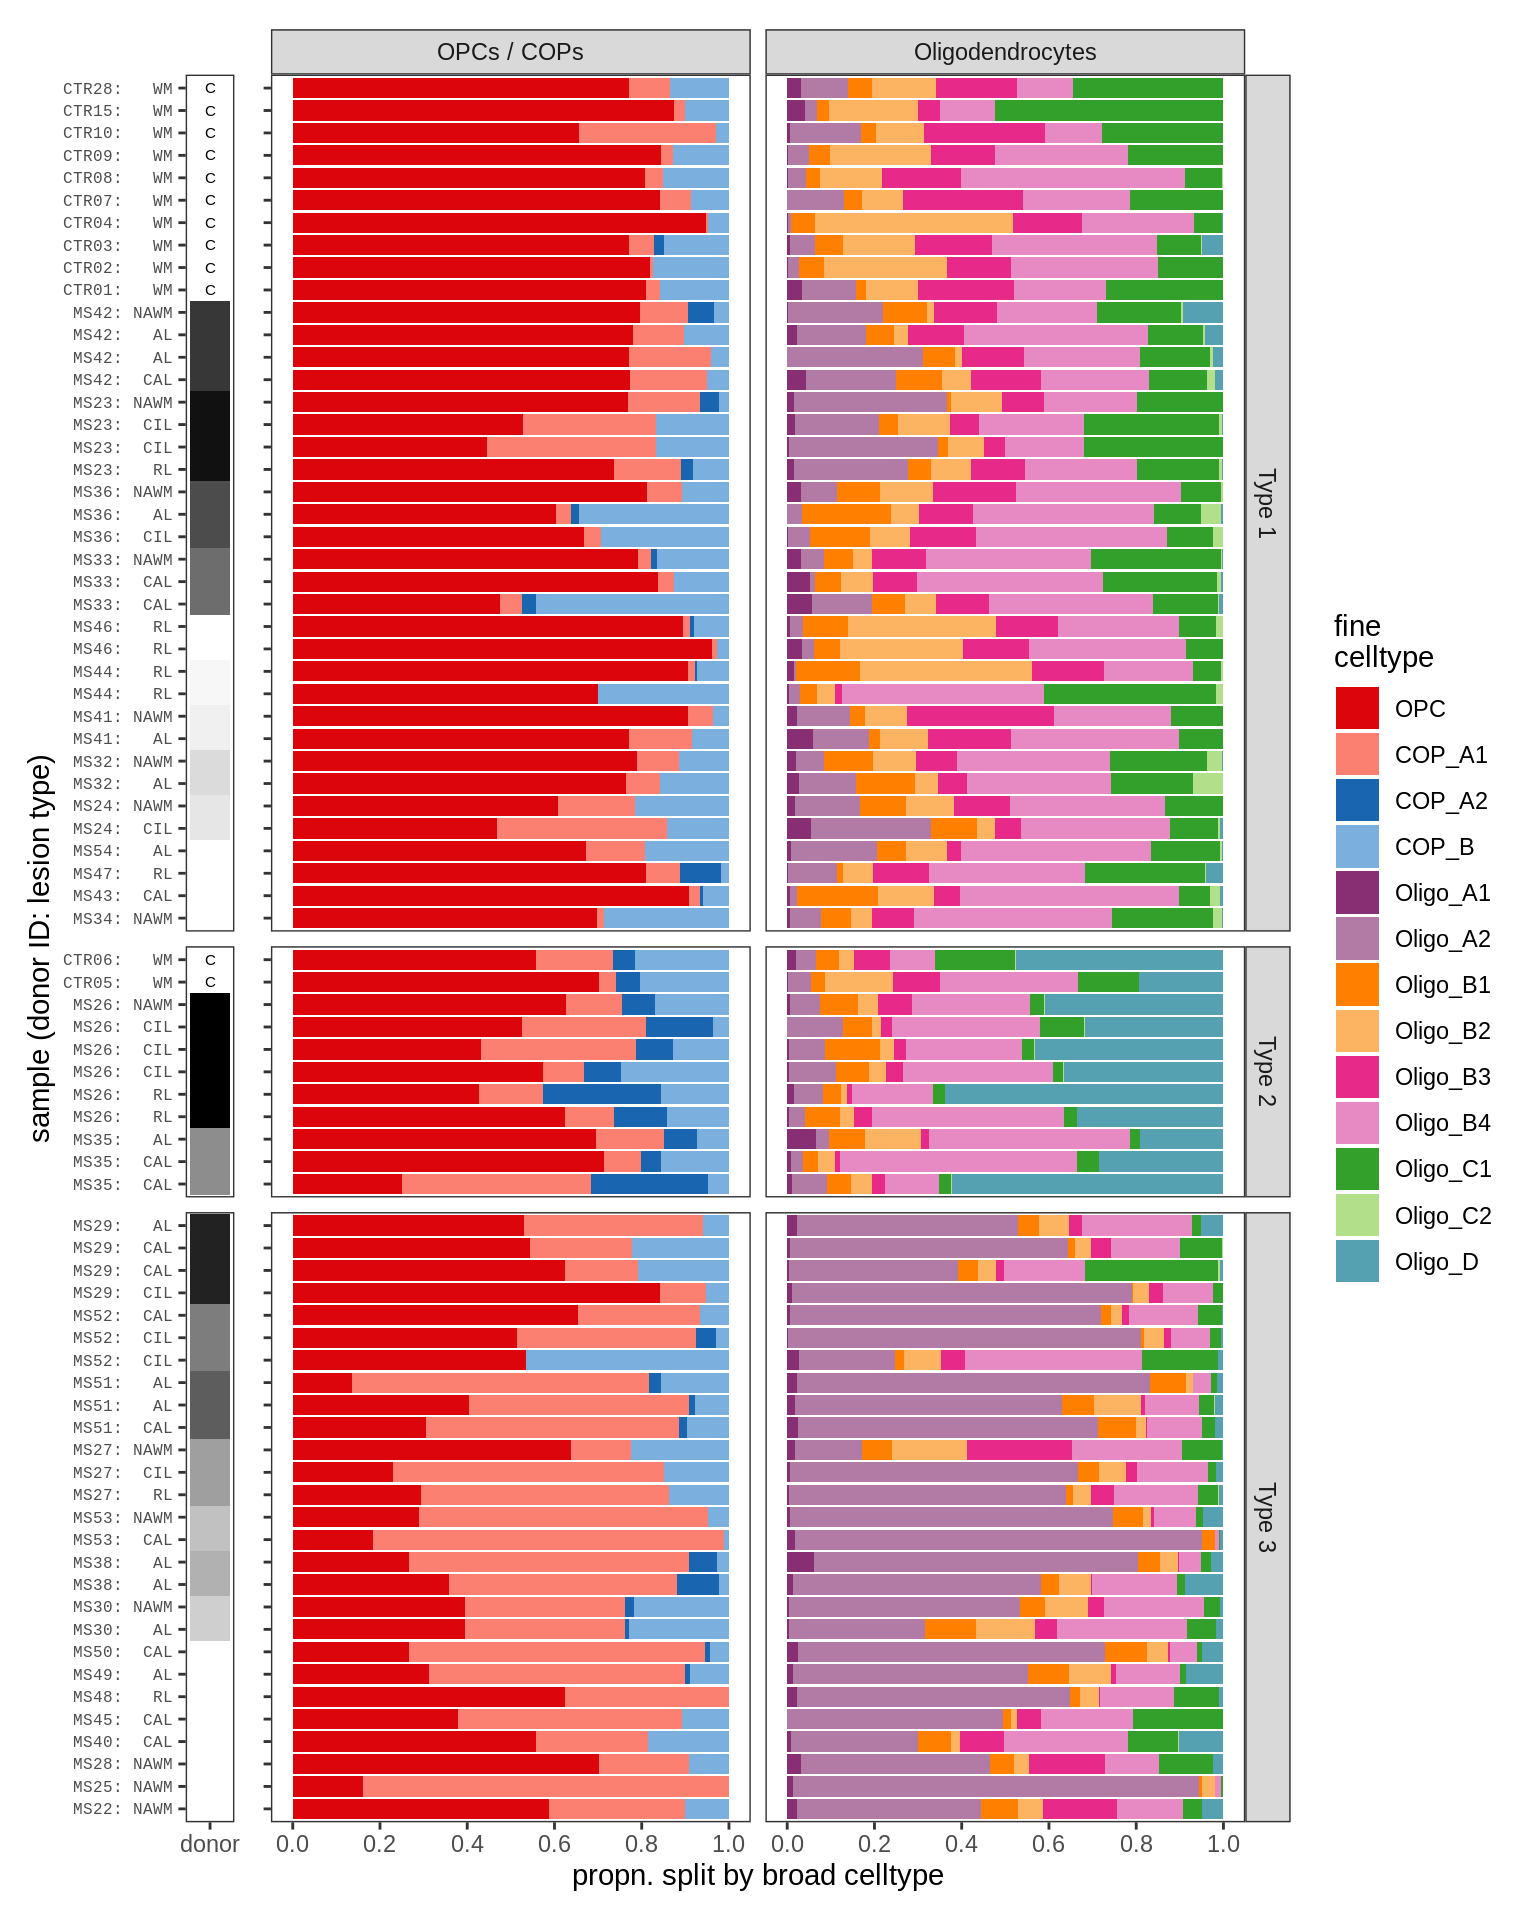
Supplementary figures
ED1a
Summary of numbers of nuclei, samples and donors excluded and retained by QC procedure, split by various metadata labels. Distributions of metadata labels split by control and MS samples: age_cat is age at death binned into categories; yrs_w_ms is years with MS, binned into categories, and NA for control samples; pmi_cat is post mortem interval, binned into categories; brain_bank is the sample source; and seq_pool is the batch in which the samples were sequenced.
include_graphics("figure/ms03_SampleQC_summary.Rmd/plot_totals_split_by_meta-1.png", error = FALSE)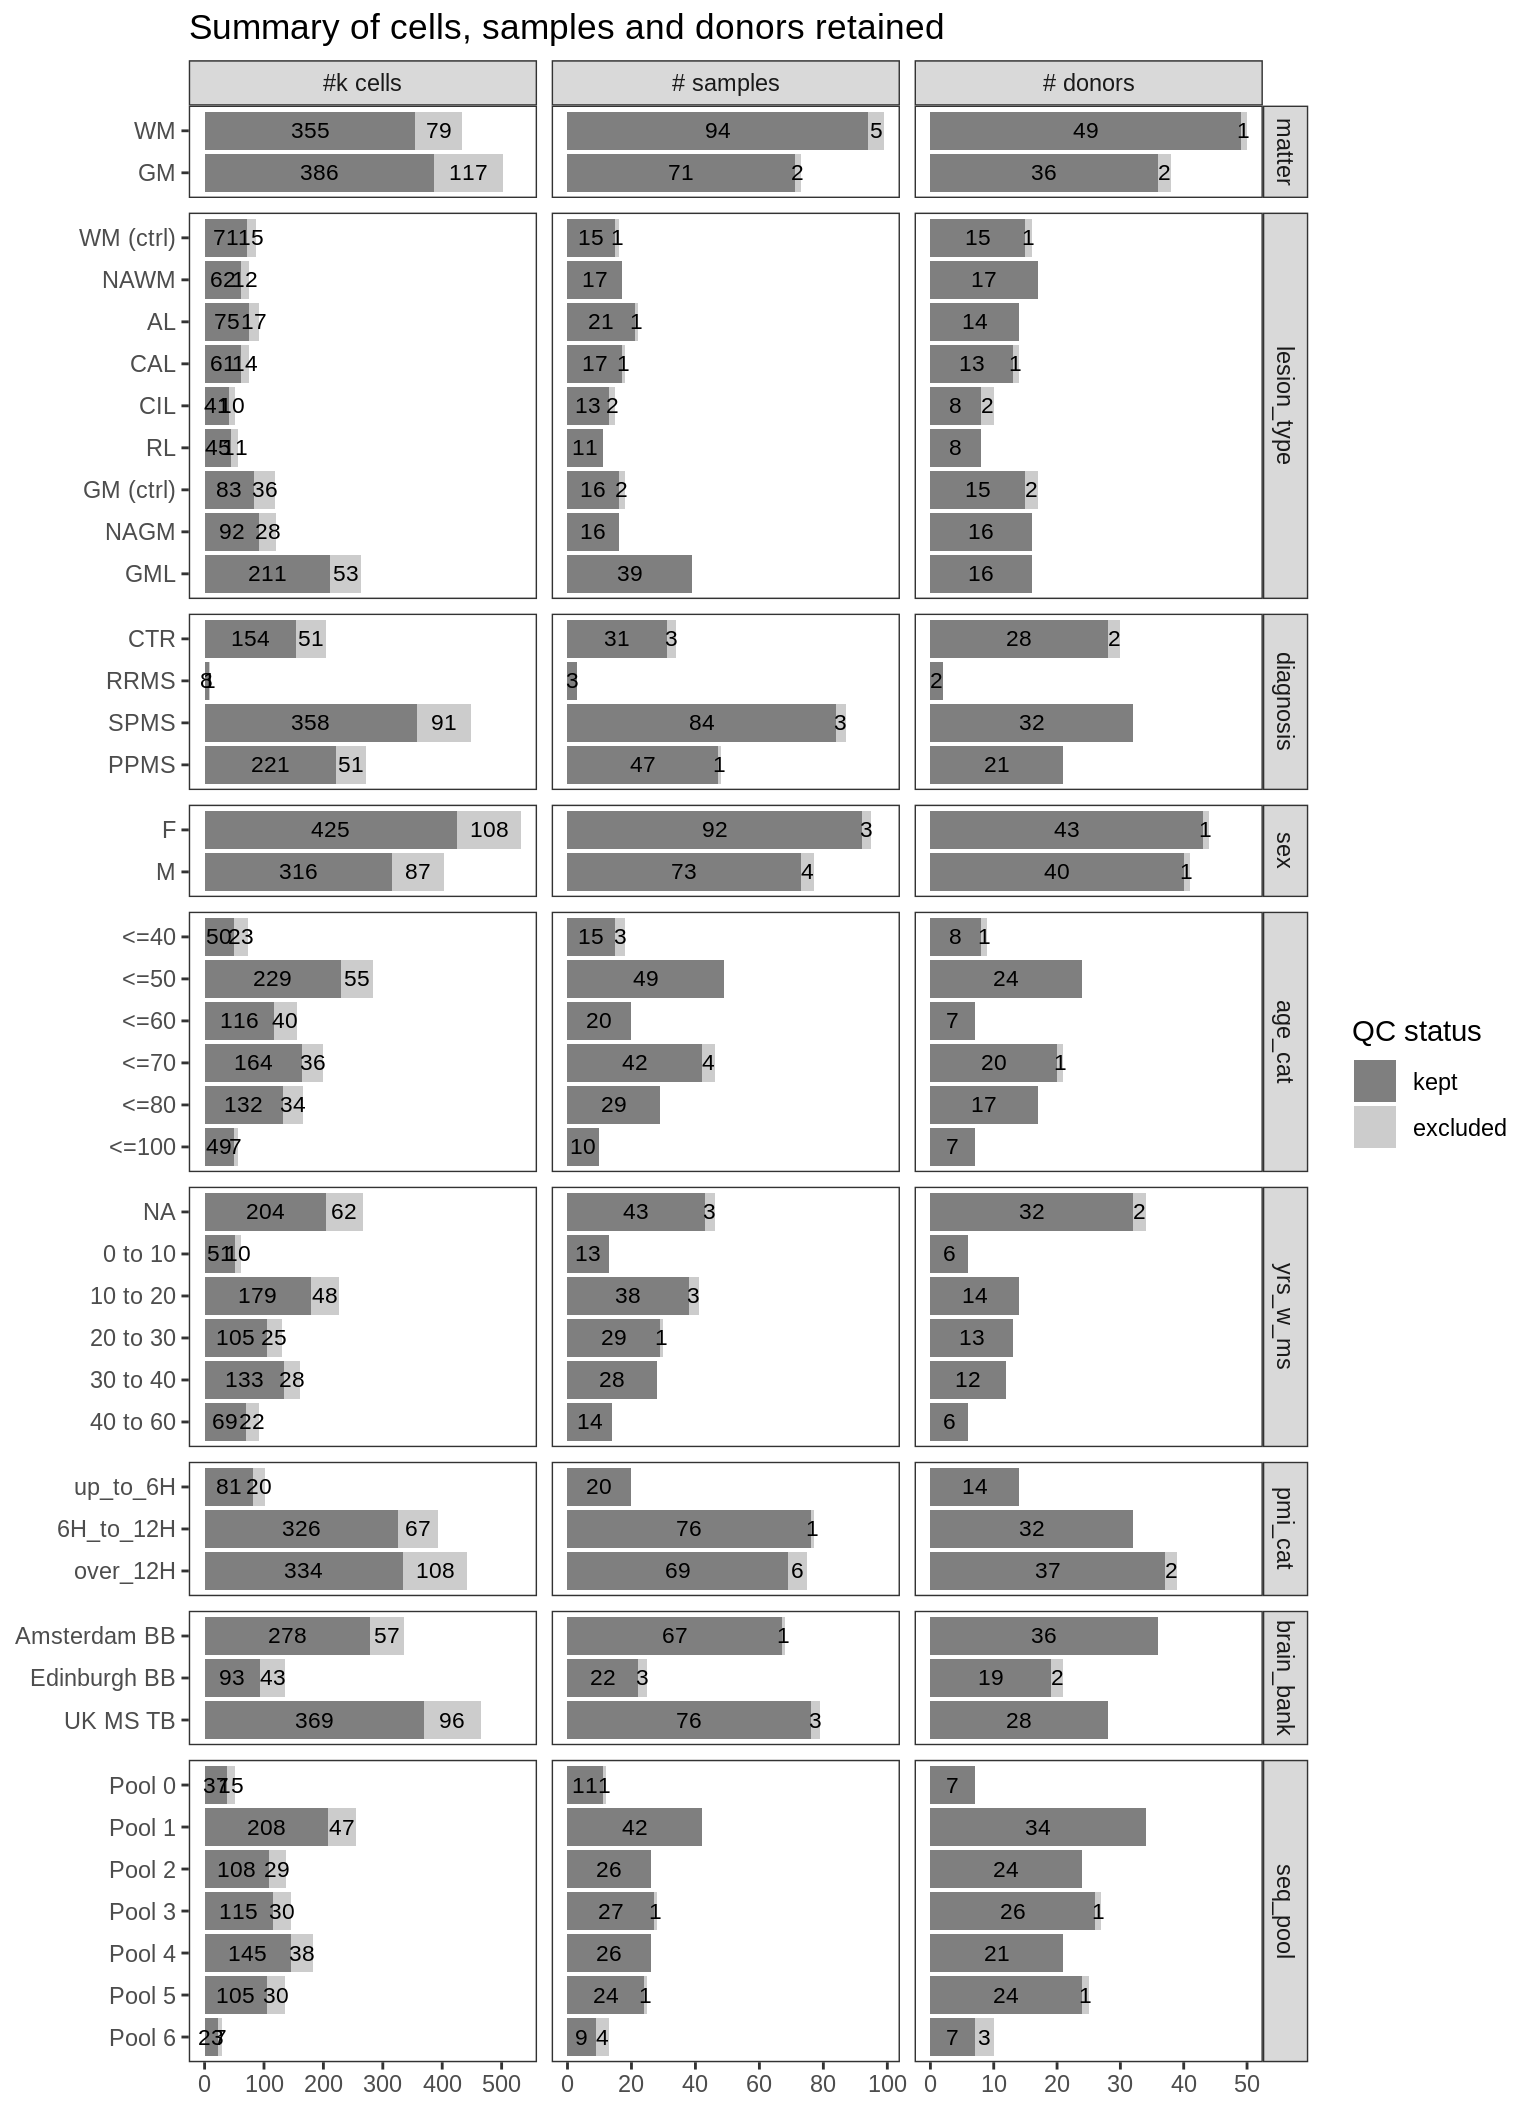
ED1b
Distributions of metadata labels split by control and MS samples. pmi_minutes is post mortem interval in minutes.
include_graphics("figure/ms03_SampleQC_summary.Rmd/plot_ctrl_vs_ms_metadata-1.png", error = FALSE)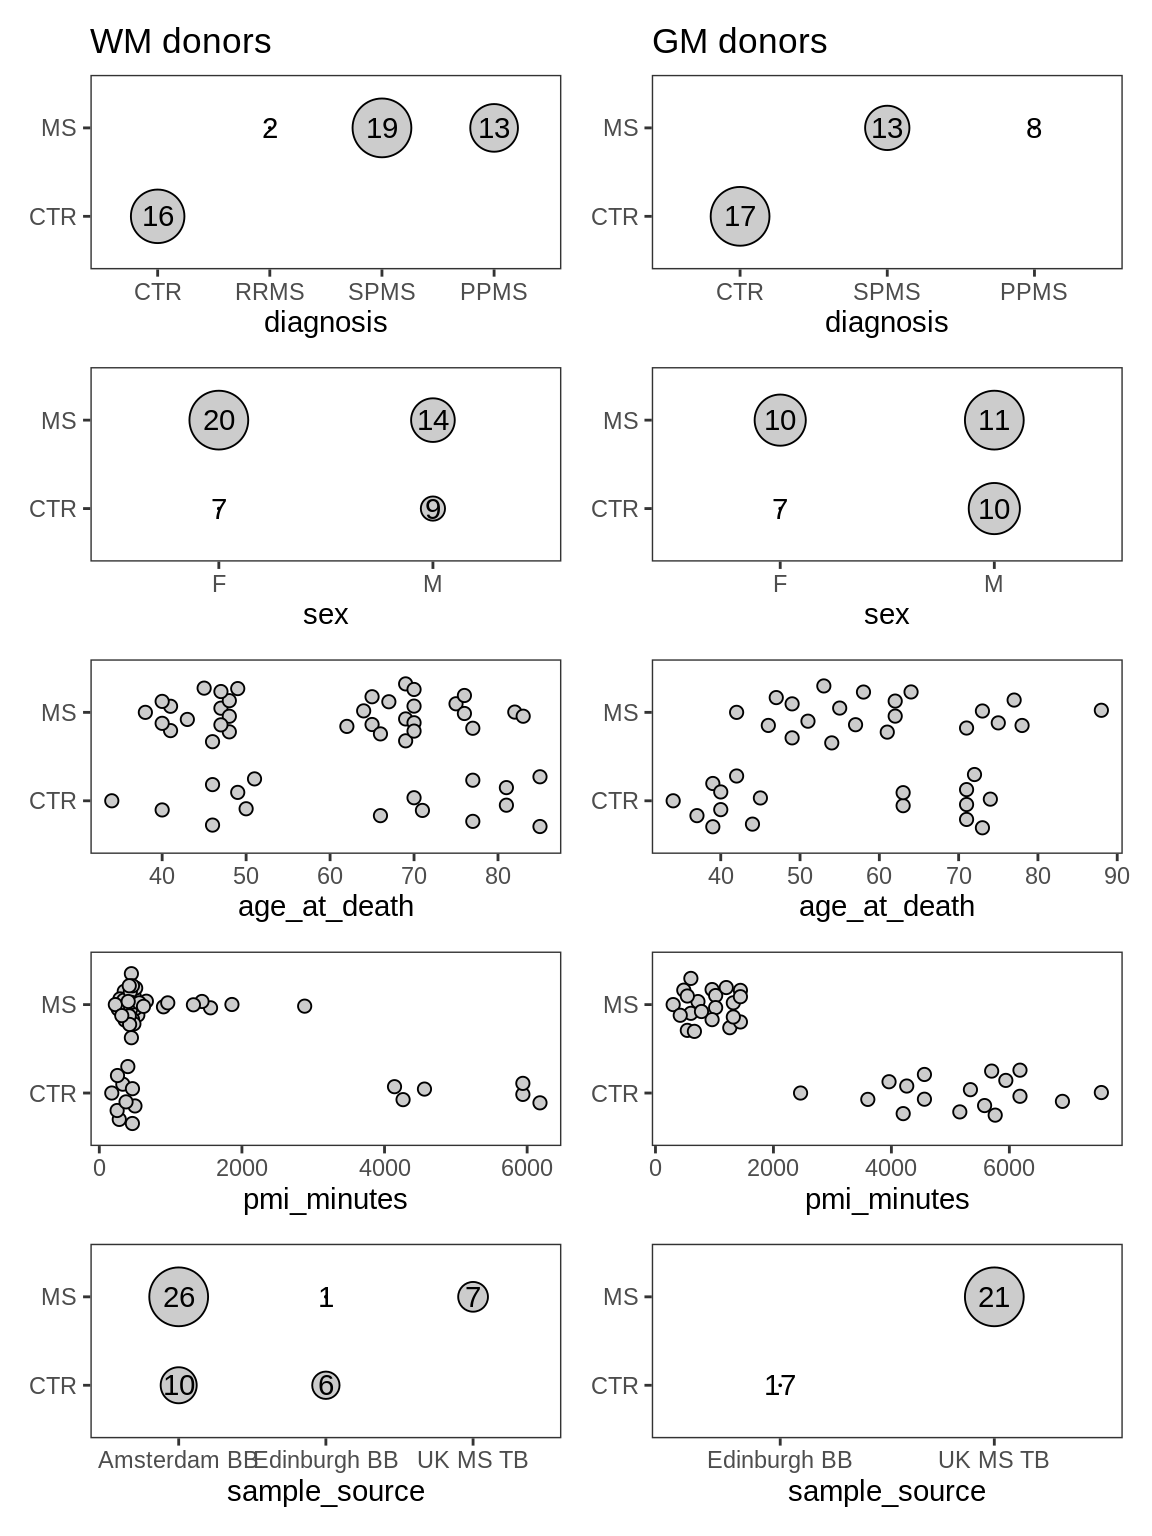
ED1c
Summary of QC metrics of post-QC WM samples. donor is colour for donor ID, with grey values used for donors contributing only one sample; mito pct is the proportion of reads in the sample that are mitochondrial; pct unspliced is the proportion of reads in the sample that are unspliced as opposed to spliced mRNA. Colours in heatmap are the z-scores for each QC metric column, with colours chosen so that red is good and blue is bad (e.g. low library size, or high mitochondrial read percentage).
include_graphics("figure/ms03_SampleQC_summary.Rmd/plot_qc_summary_heatmap-1.png", error = FALSE)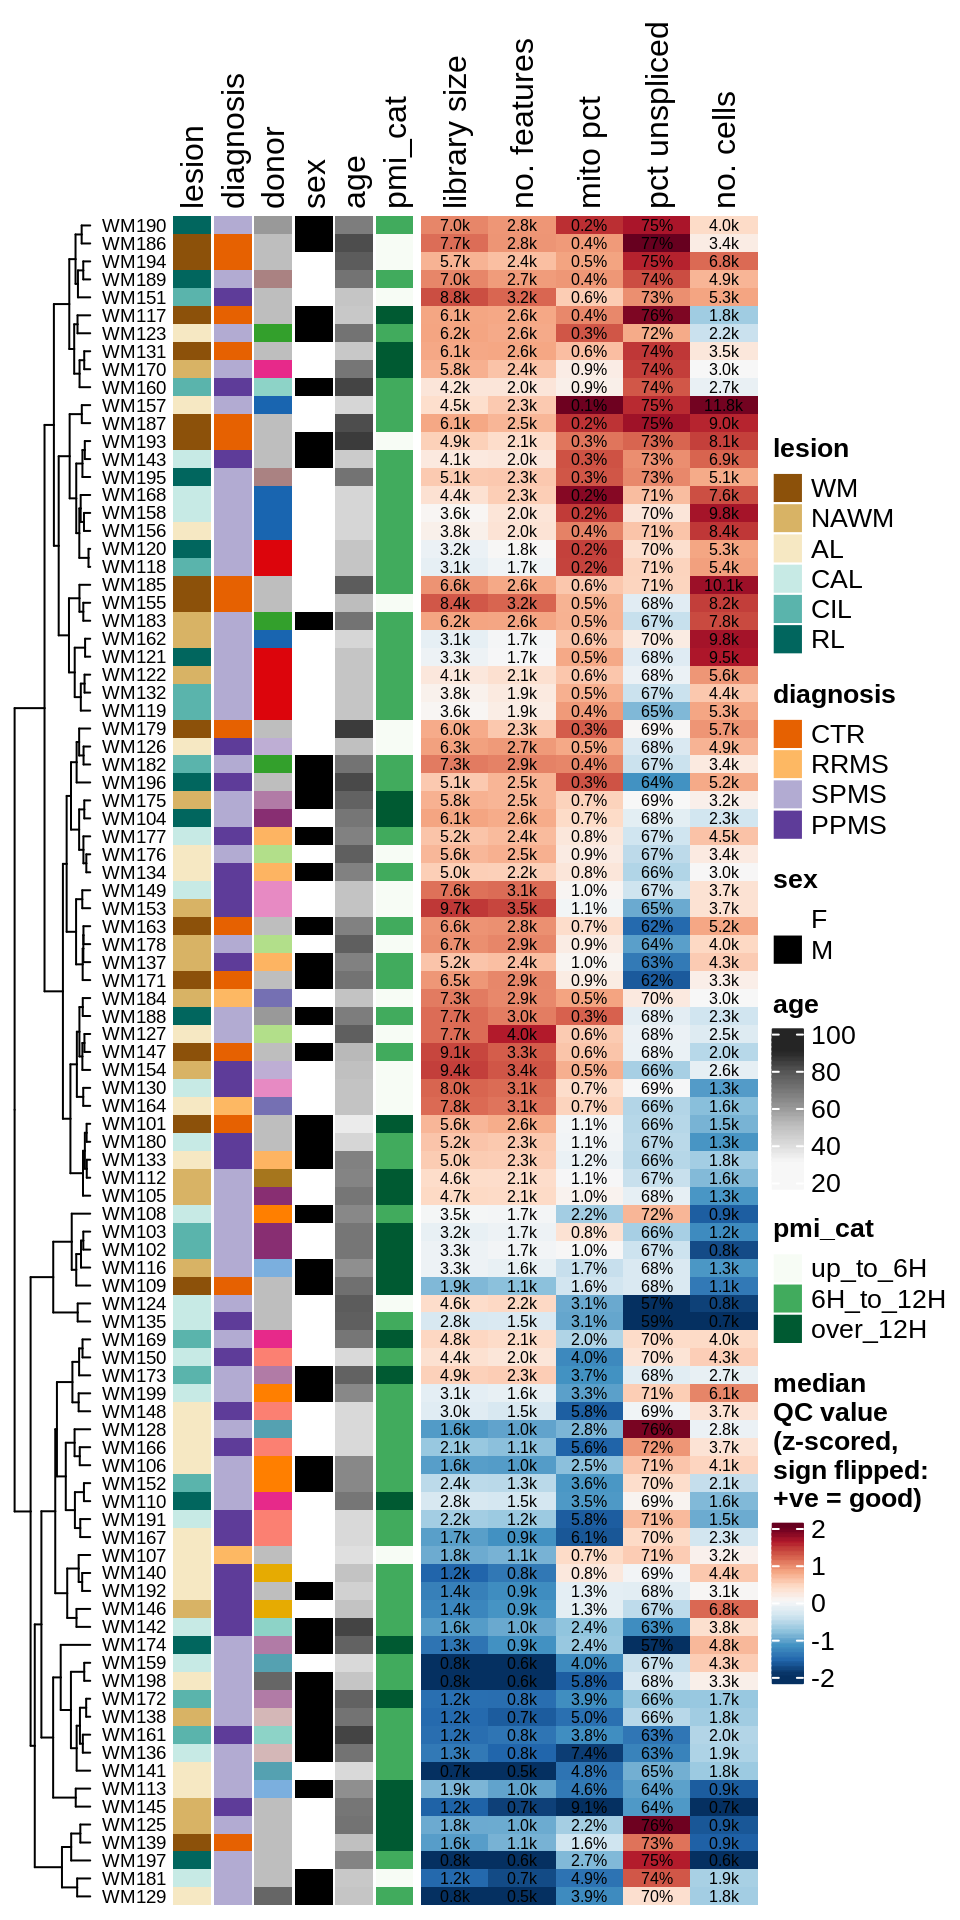
ED1d
Summary of QC metrics of post-QC GM samples, as for ED1c.
include_graphics("figure/ms03_SampleQC_summary.Rmd/plot_qc_summary_heatmap-2.png", error = FALSE)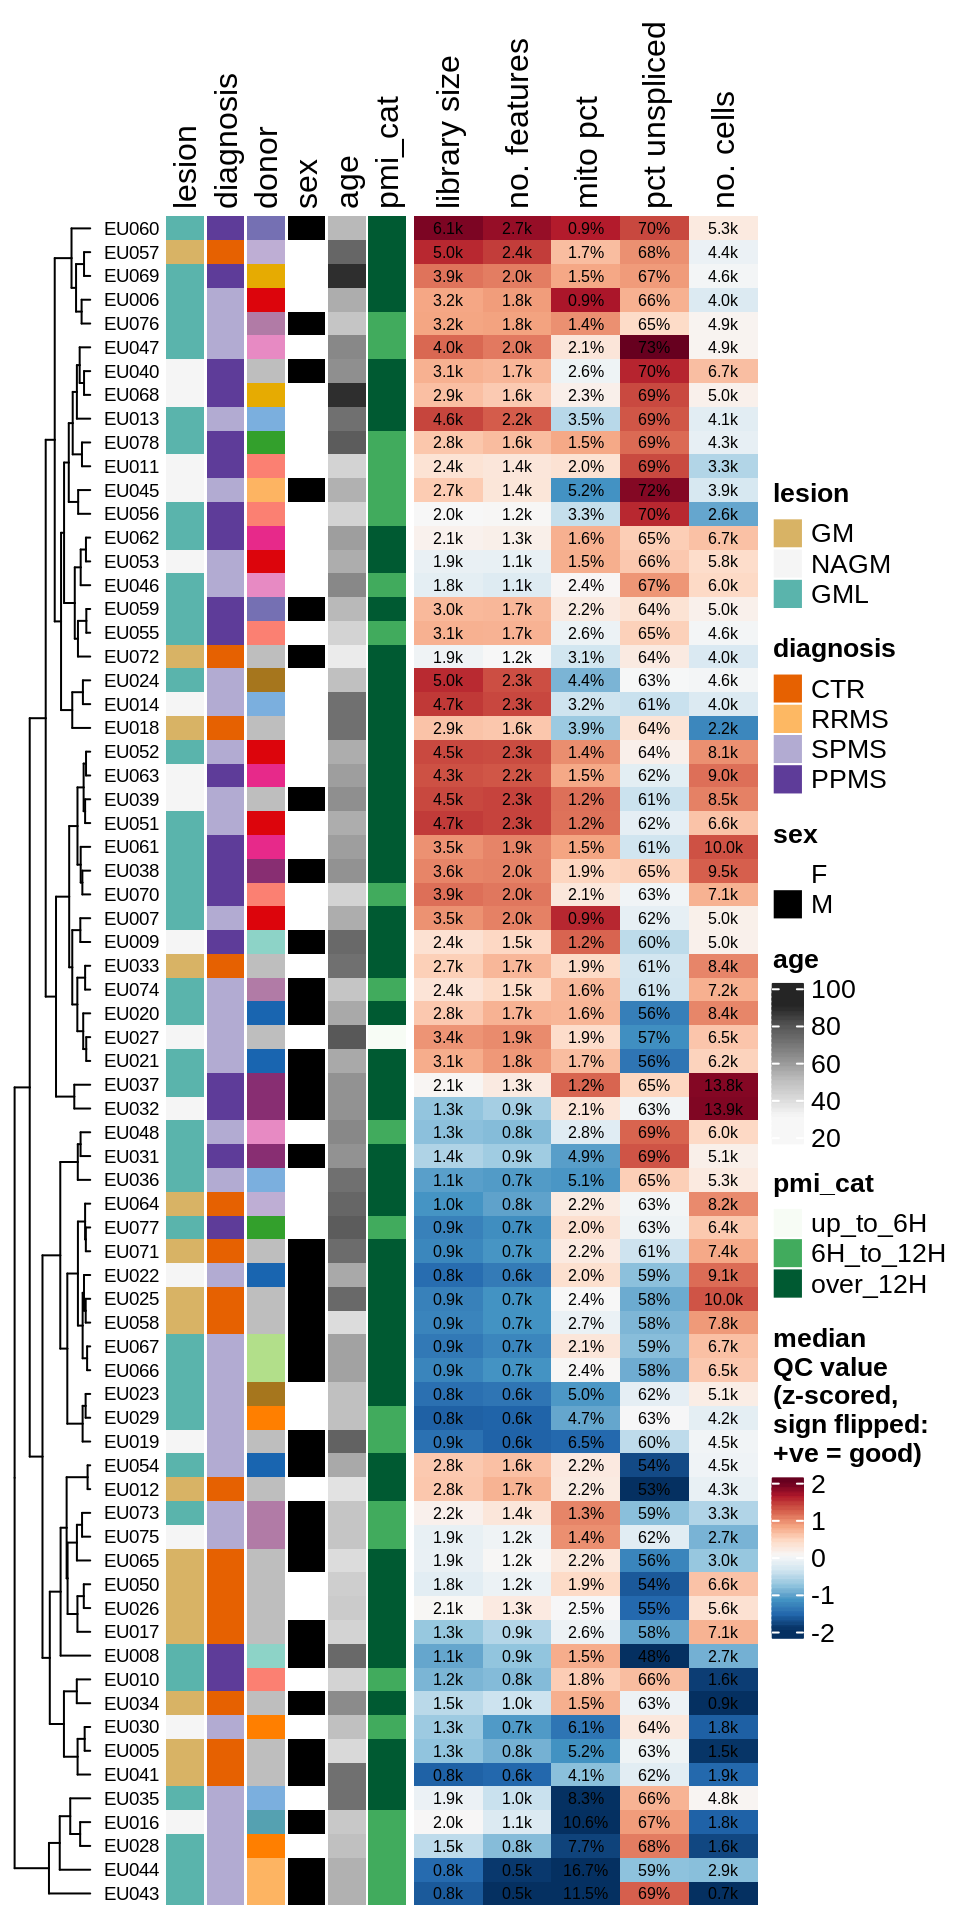
ED1e
QC metric summaries for fine celltypes. Each point is a sample with >= 10 nuclei of that type, showing median QC metric value for those nuclei in that sample (with exception of number of nuclei).
include_graphics("figure/ms13_labelling.Rmd/plot_qc_stats_by_cluster-1.png", error = FALSE)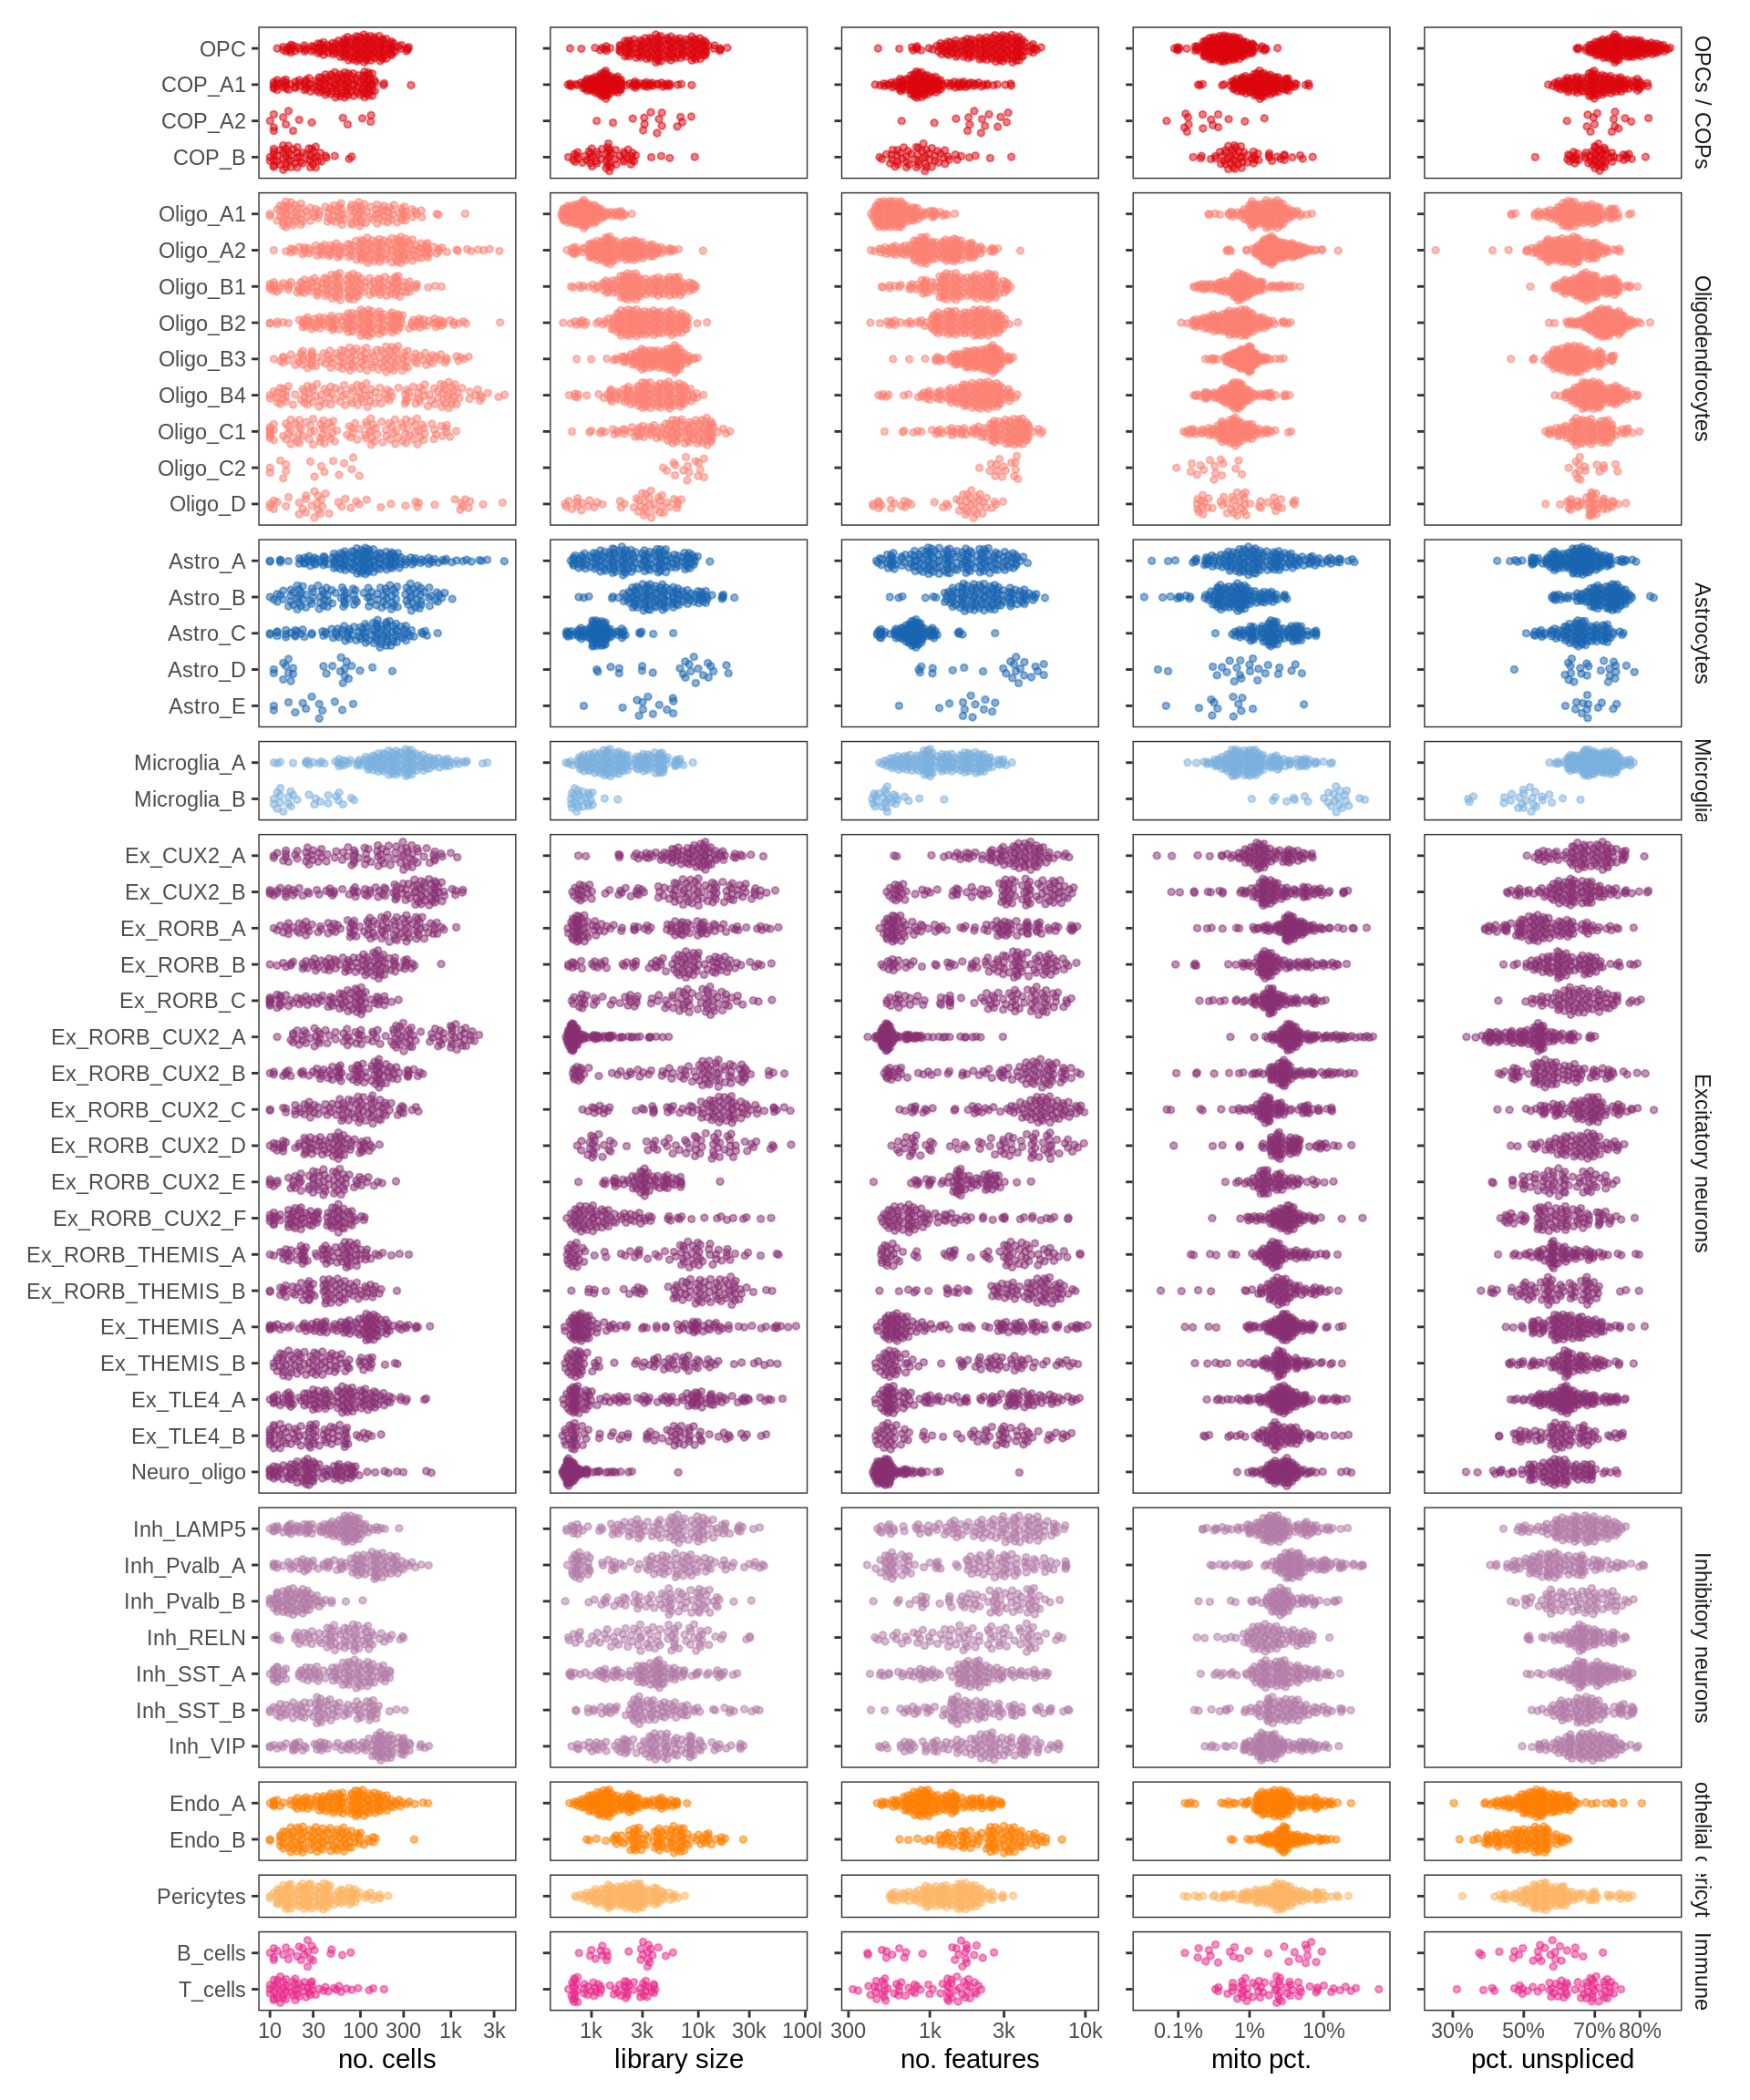
ED2a
UMAP embedding (as in Fig. 1b) annotated with proportion of nuclei in binned region of UMAP embedding coming from MS as opposed to control samples (left) and WM as opposed to GM samples (right). In both plots, white corresponds to the average proportion across all cells (i.e. 20% of nuclei are from MS samples, and 60% of nuclei are from GM samples).
include_graphics("figure/ms08_modules.Rmd/plot_umap_ctr_ms-1.png", error = FALSE)
ED2b
Expression of marker genes selected for broad celltypes, and for fine celltypes. CPM indicates counts per million, number of counts of gene divided by total number of pseudobulk counts. Expression calculated across all cells and samples.
include_graphics("figure/ms12_markers.Rmd/plot_dotplot_dheeraj_compact-1.png", error = FALSE)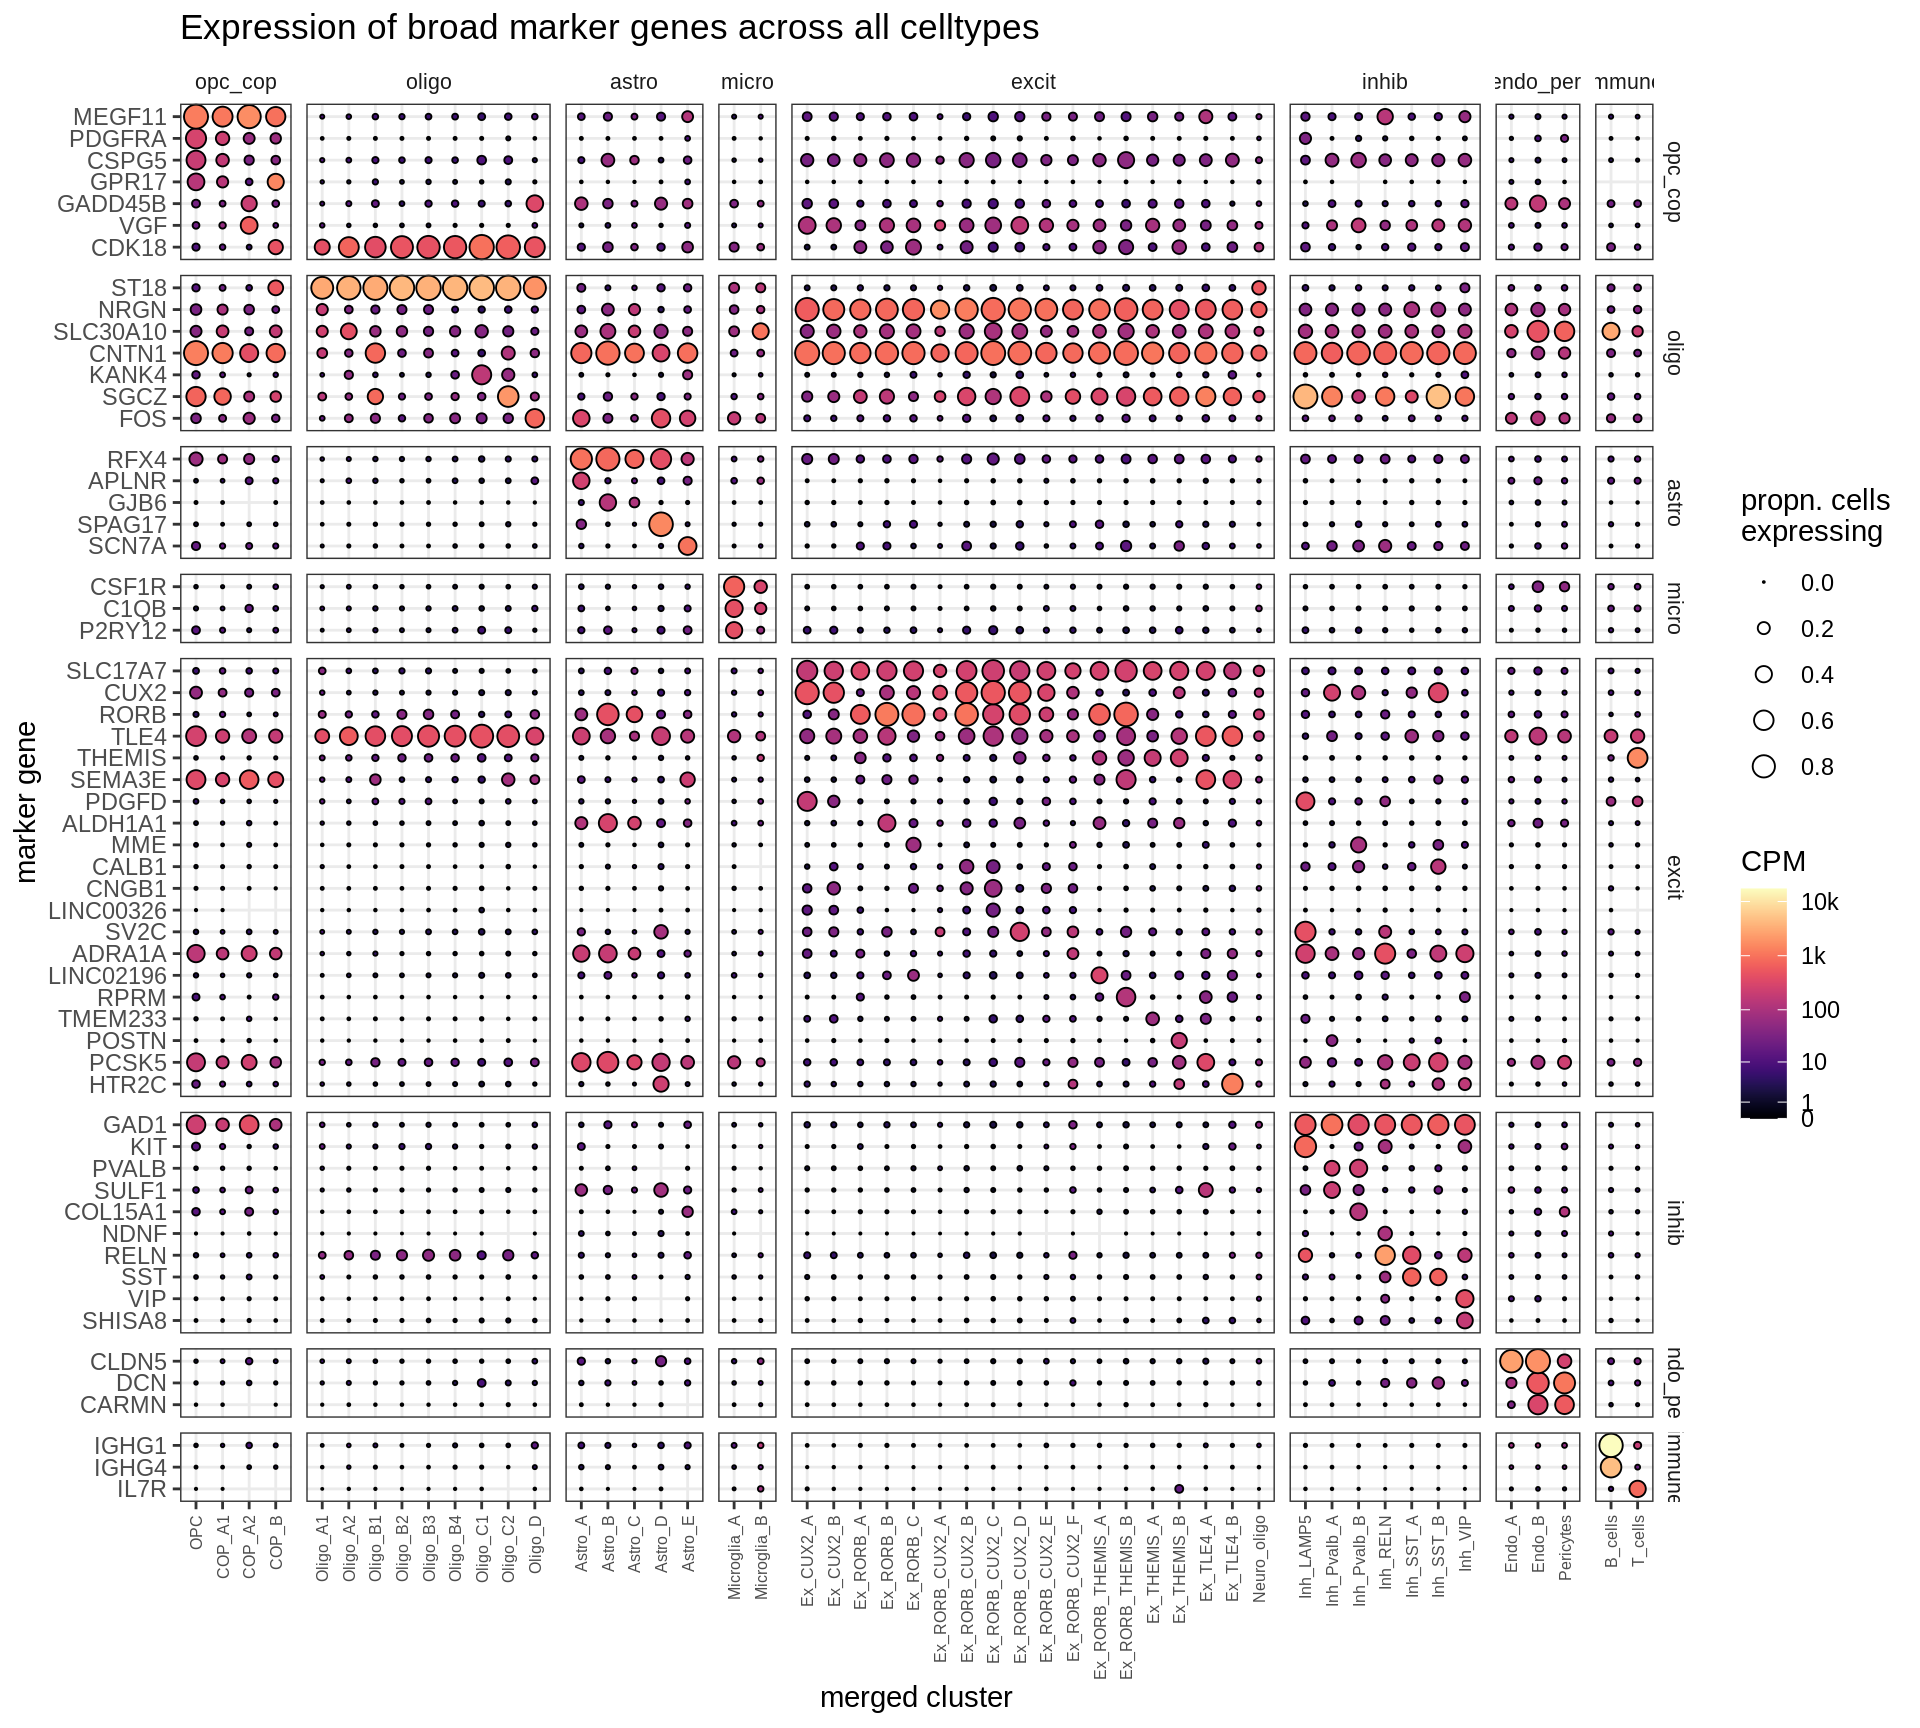
ED2c
Comparison of clusters with Seurat clusters.
include_graphics("figure/additional_figures/Conos_celltypes_perc_of_cells_in_Seurat.png", error = FALSE)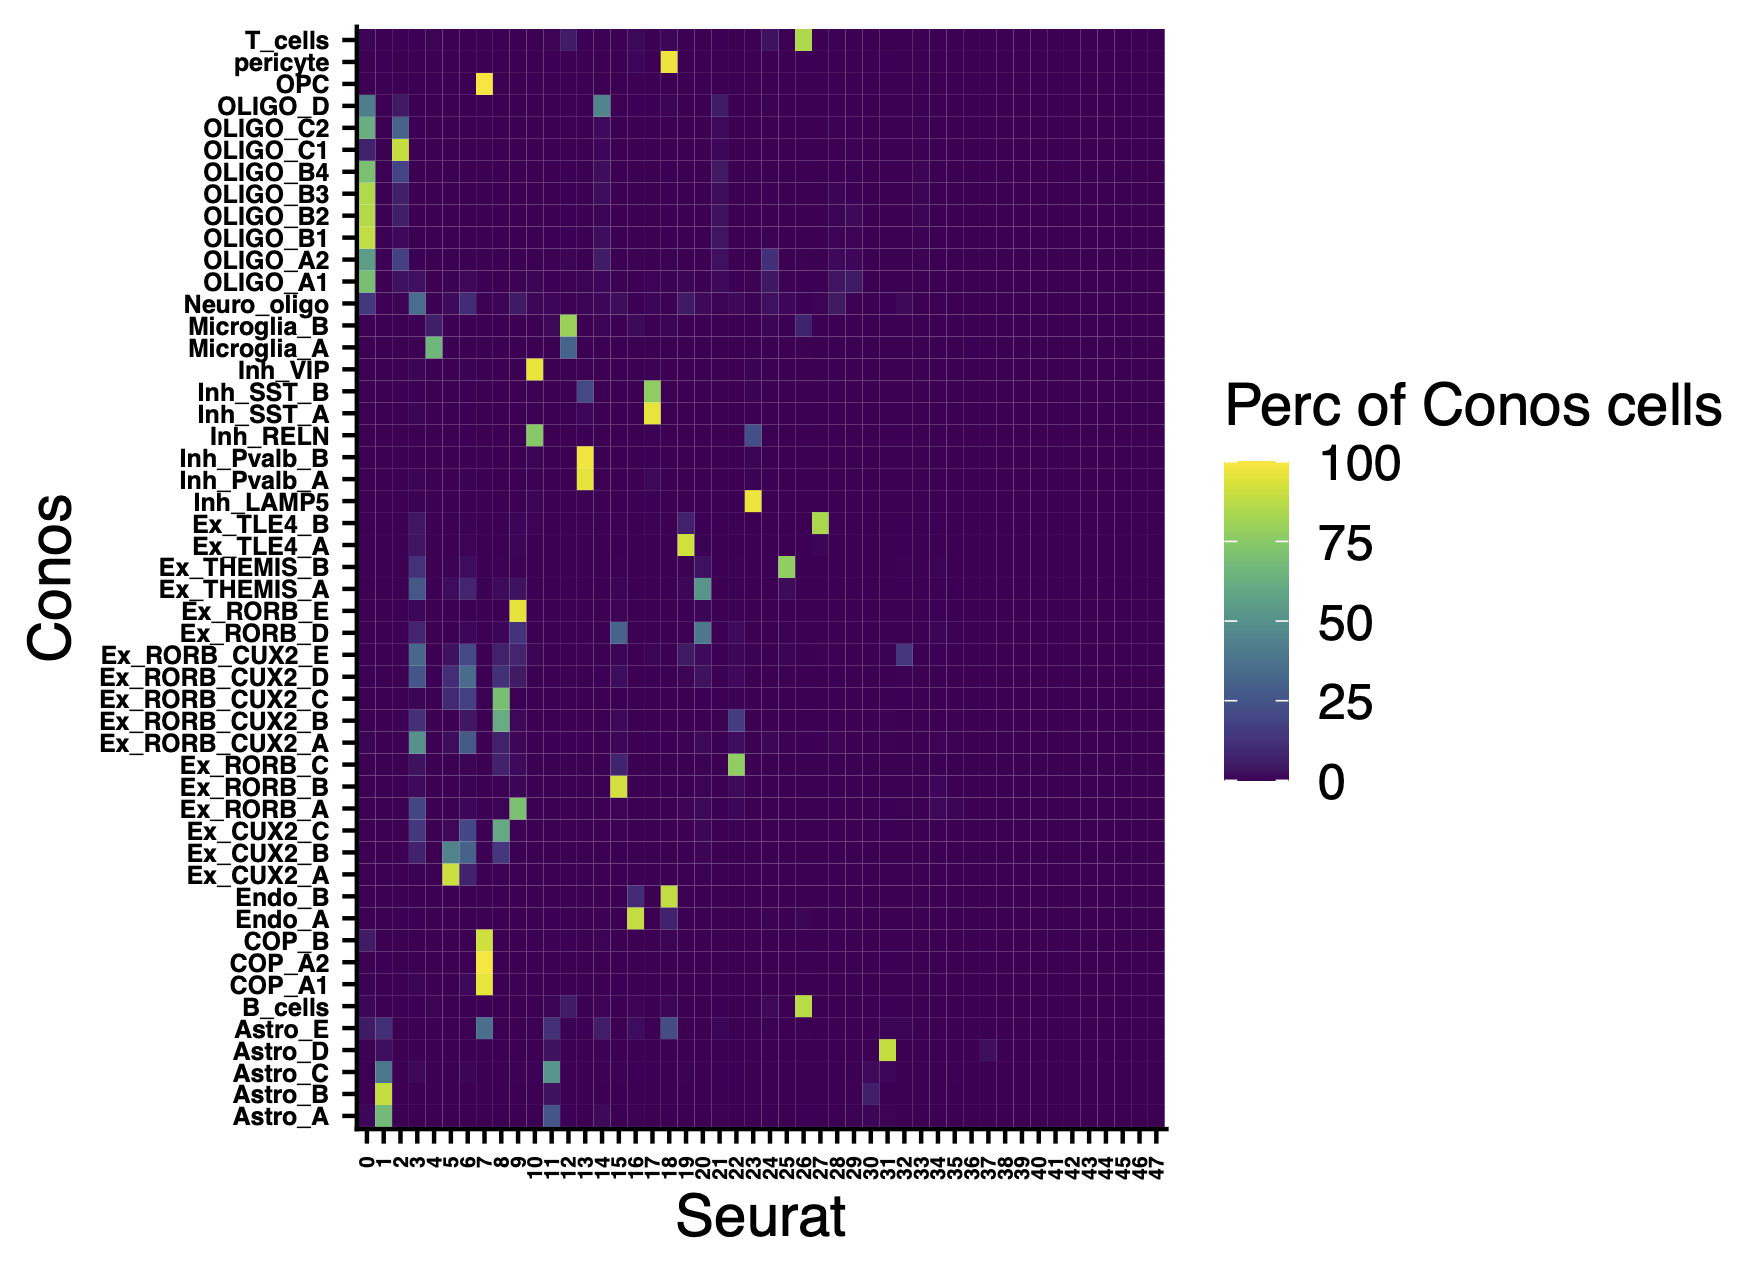
ED2d
include_graphics("figure/ms13_labelling.Rmd/plot_cluster_entropies-1.png", error = FALSE)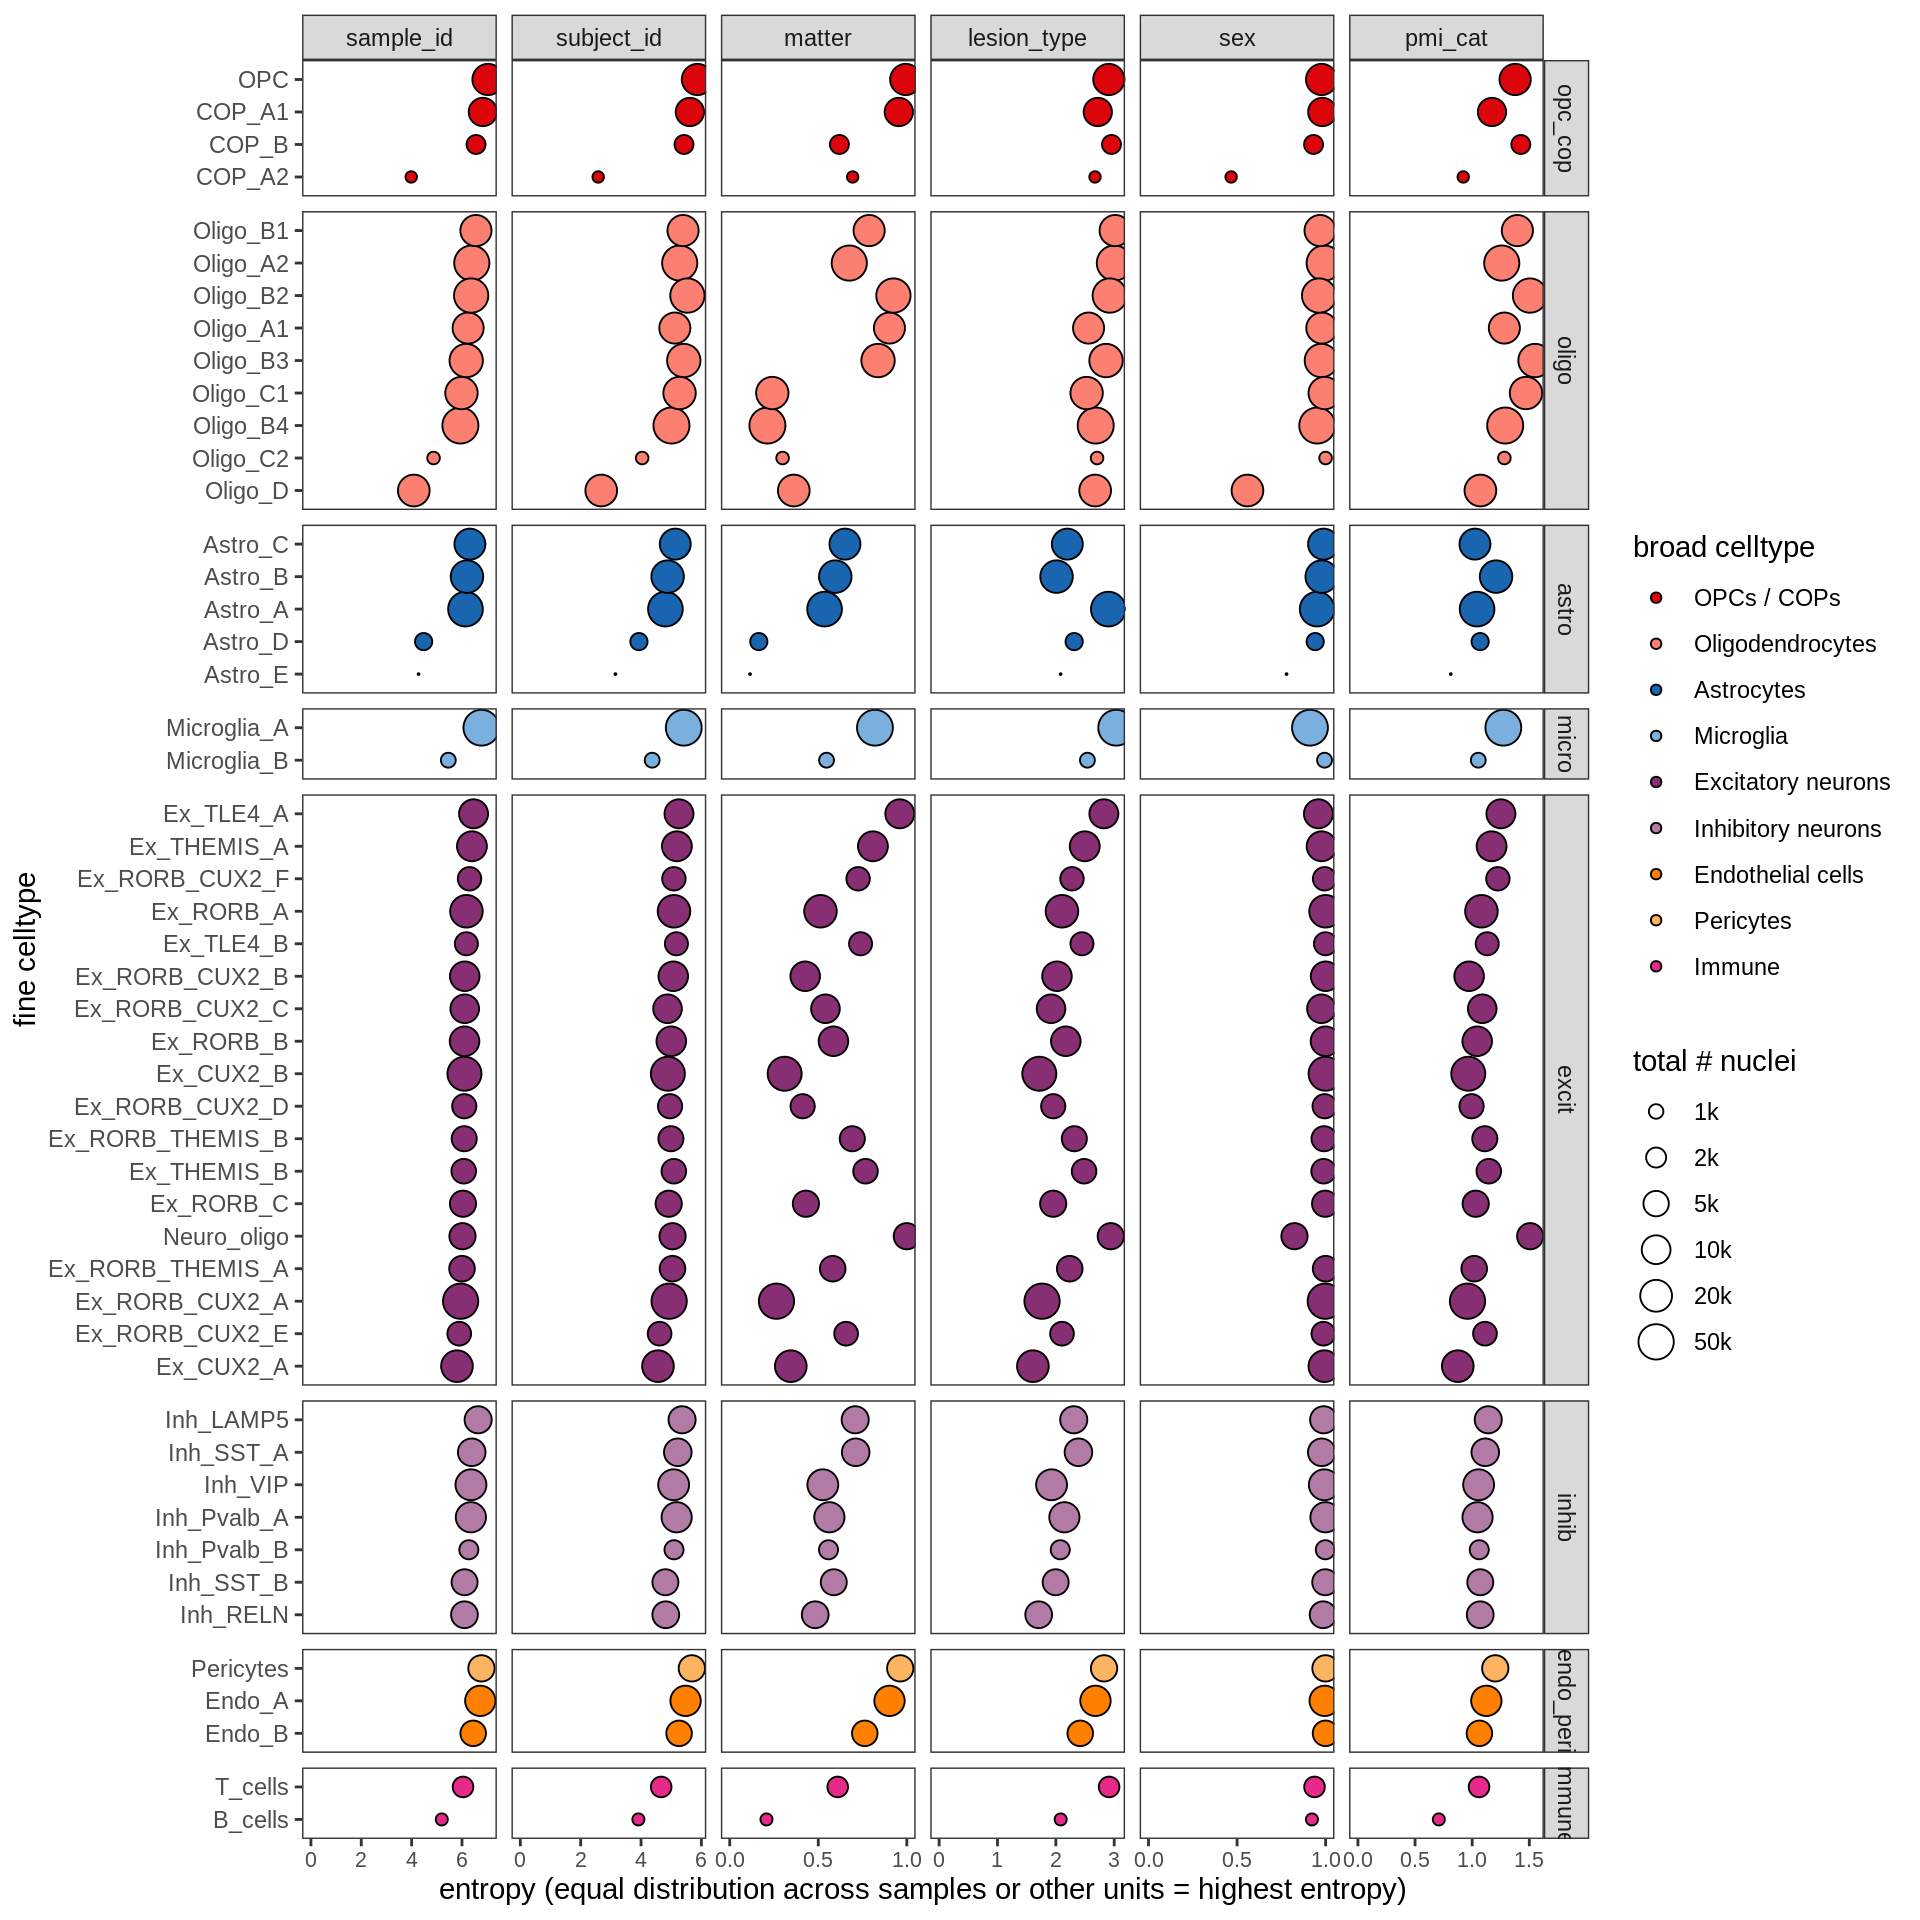
ED2e
Expression of top genes for each oligo-OPC module (gene selected if weight >2%). Expression calculated across all cells and samples.
include_graphics("figure/ms08_modules.Rmd/plot_genes_dotplot-2.png", error = FALSE)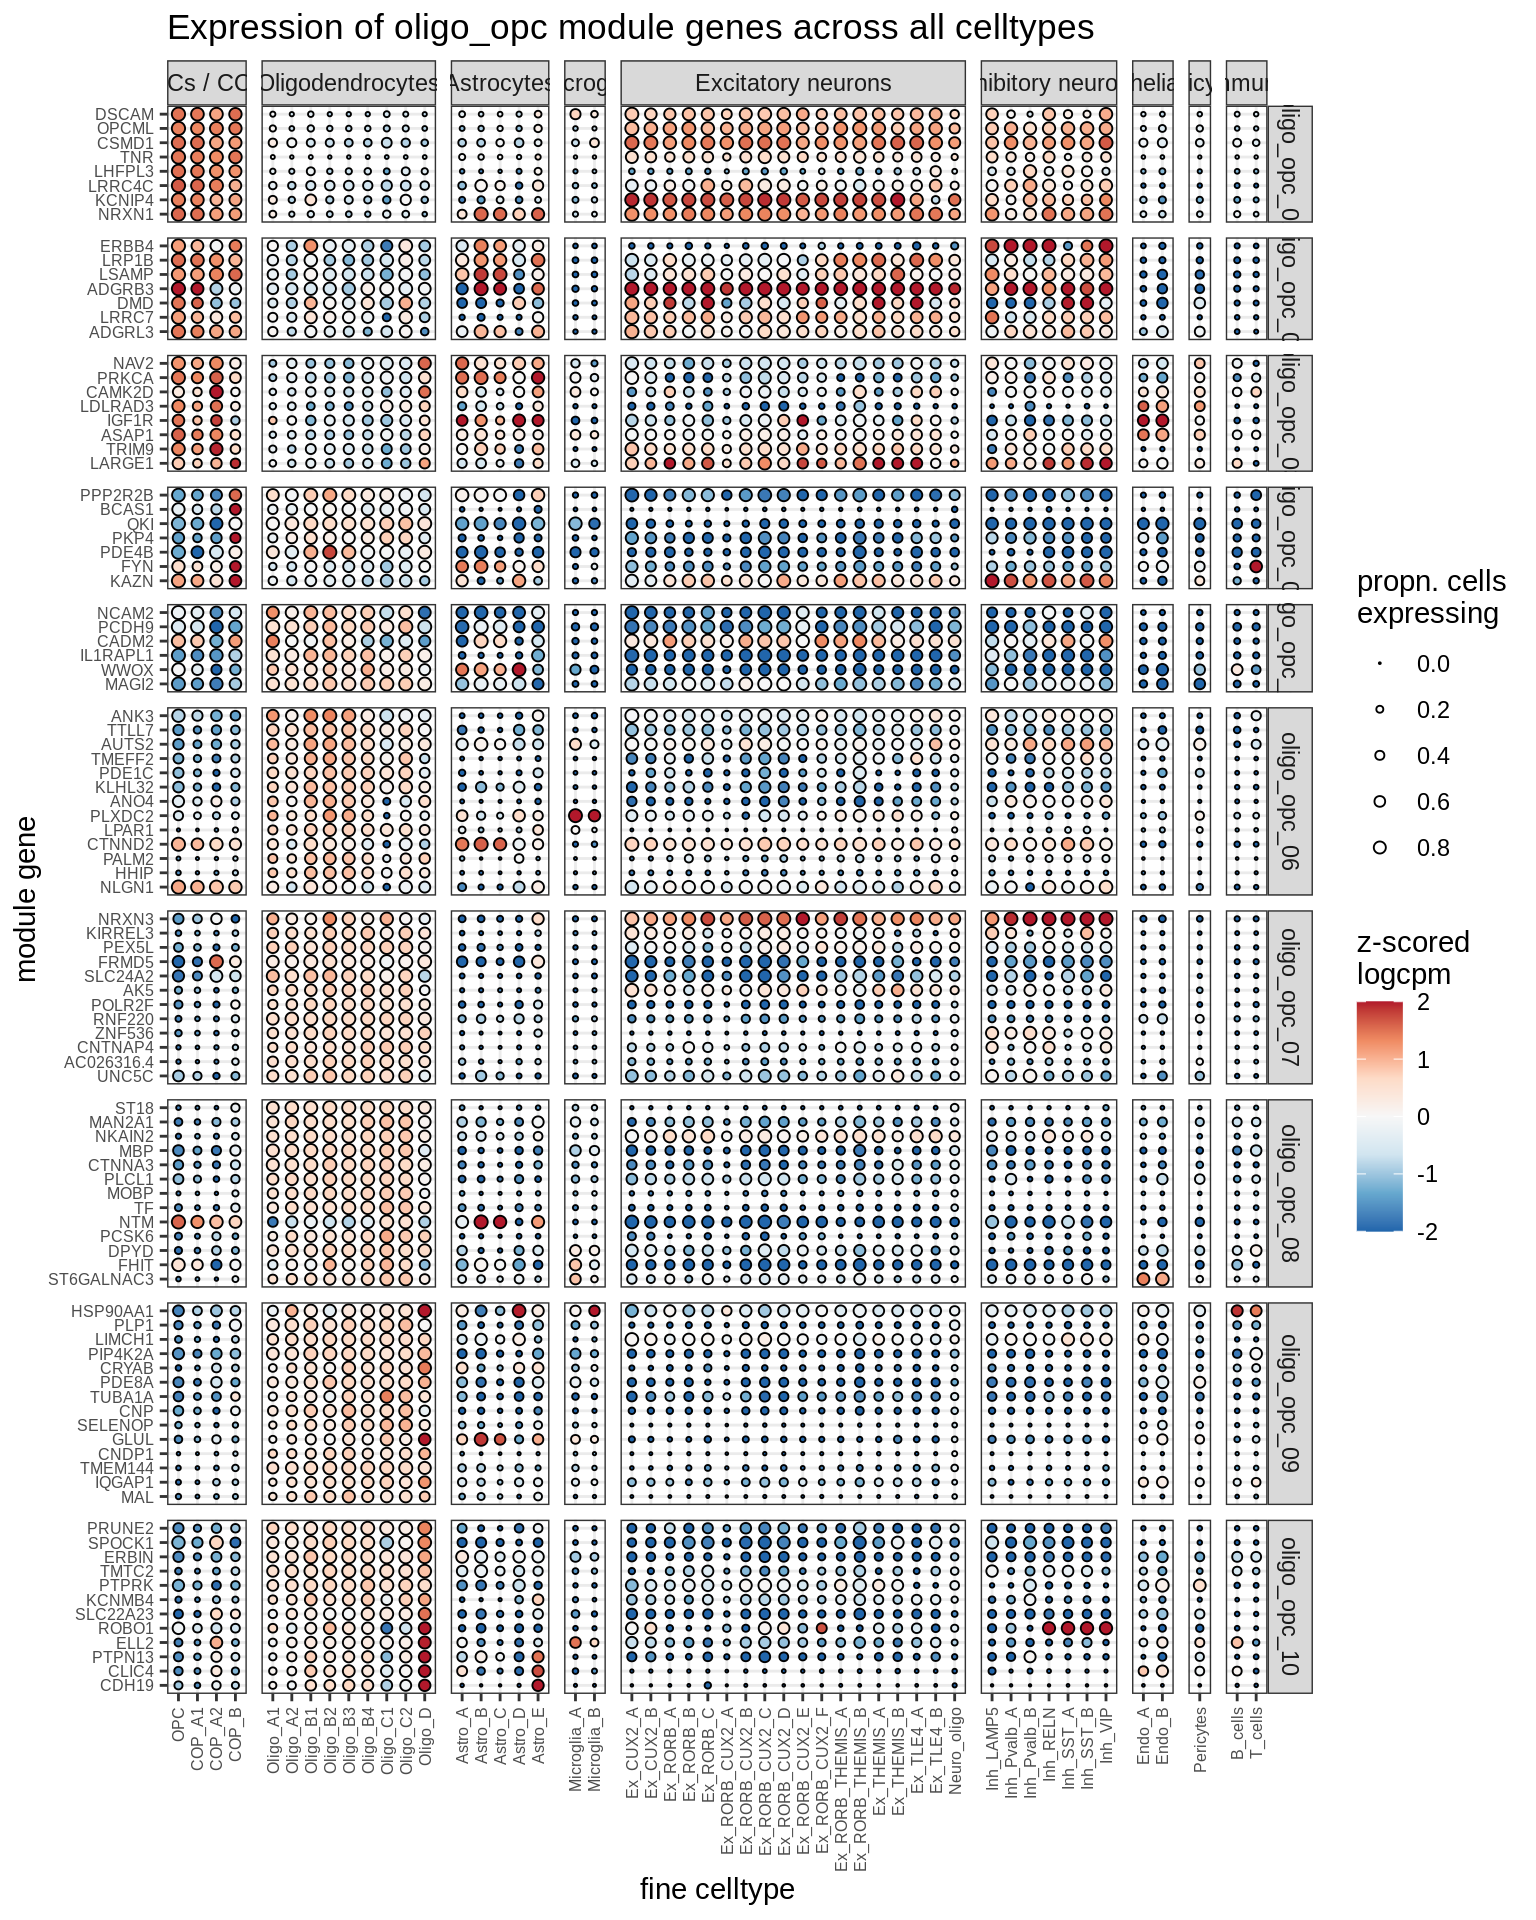
ED3a
Distribution of model fits for genes for each broad celltype in GM. y-axis shows standard deviation of random (donor) effects for each gene. x-axis shows log2FC of lesion type with smallest p-value for each gene. Horizontal dashed lines show cutoff at SD = log(1.5); vertical dashed lines show cutoff at abs(log2FC) = log(1.5).
include_graphics("figure/ms15_mofa_gm_edger_libs.Rmd/fig_interesting_gs-1.png", error = FALSE)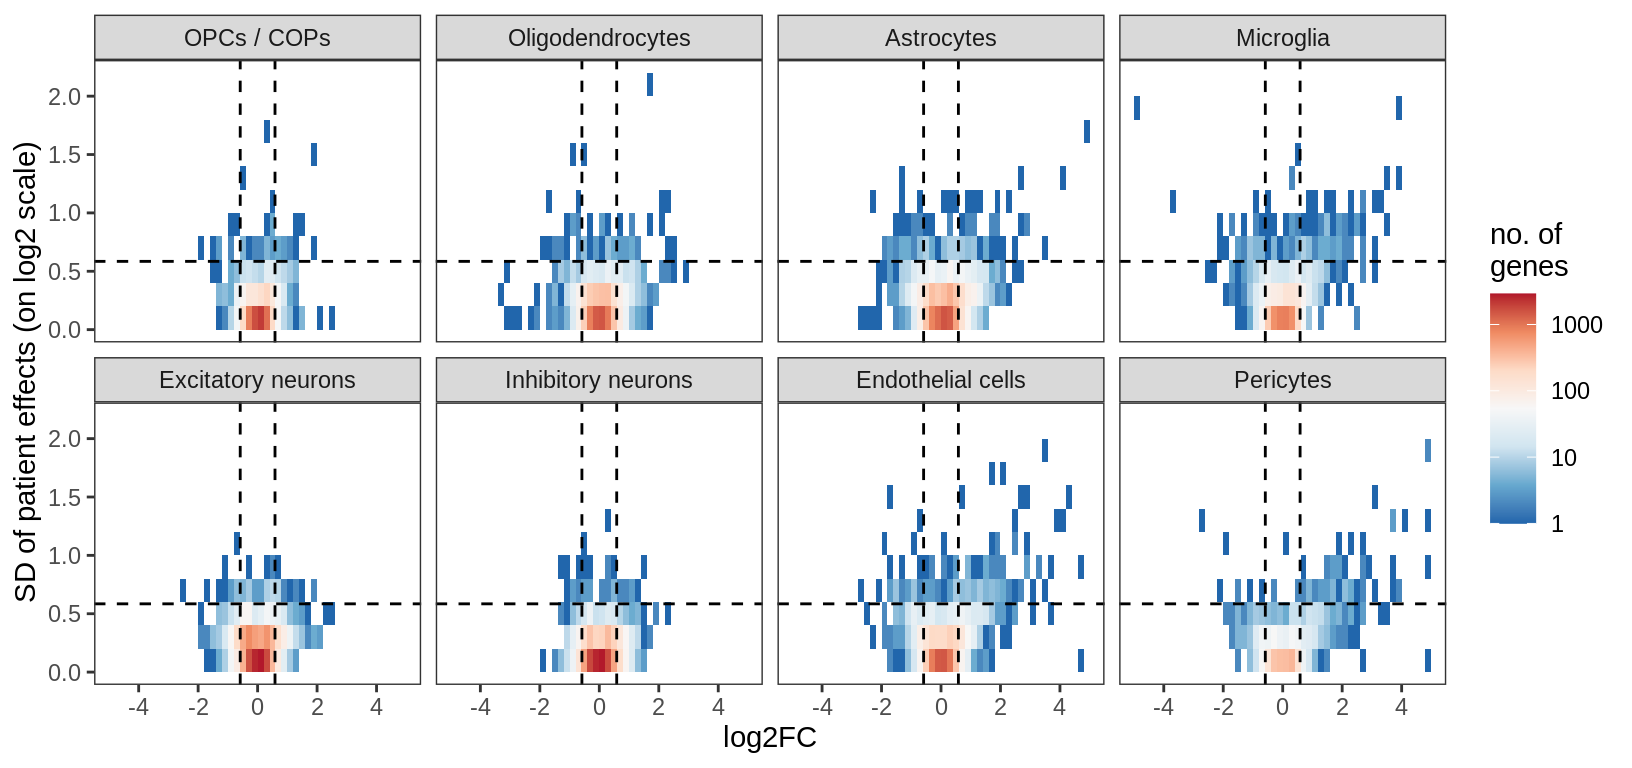
ED3b
Distribution of model fits for genes for each broad celltype in WM. y-axis shows standard deviation of random (donor) effects for each gene. x-axis shows log2FC of lesion type with smallest p-value for each gene. Horizontal dashed lines show cutoff at SD = log(1.5); vertical dashed lines show cutoff at abs(log2FC) = log(1.5).
include_graphics("figure/ms15_mofa_wm_edger_libs.Rmd/fig_interesting_gs-1.png", error = FALSE)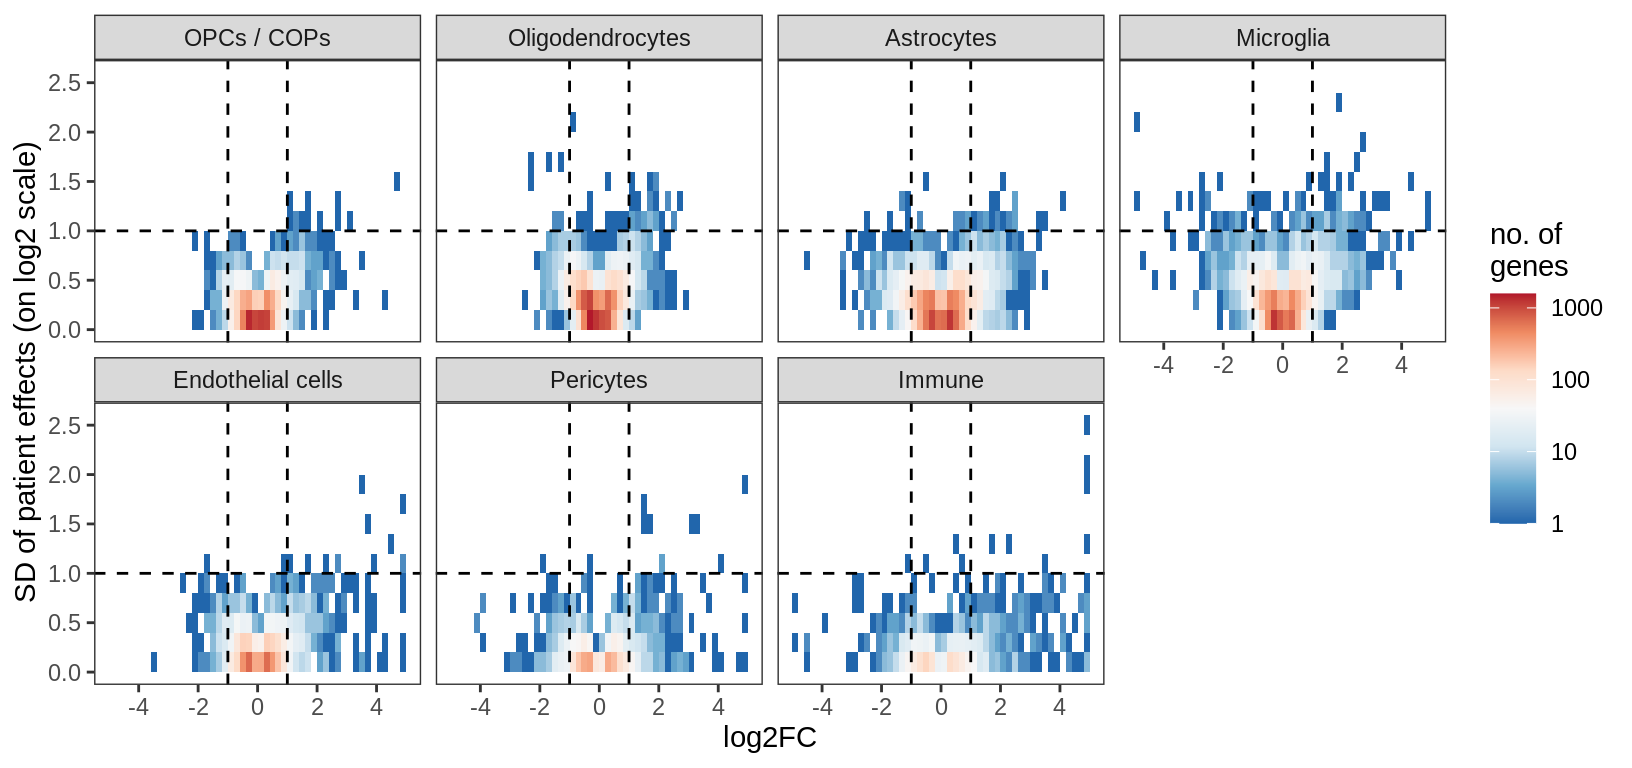
ED4a
include_graphics("figure/ms99_deg_figures_gm.Rmd/plot_de_barplot_fine-1.png", error = FALSE)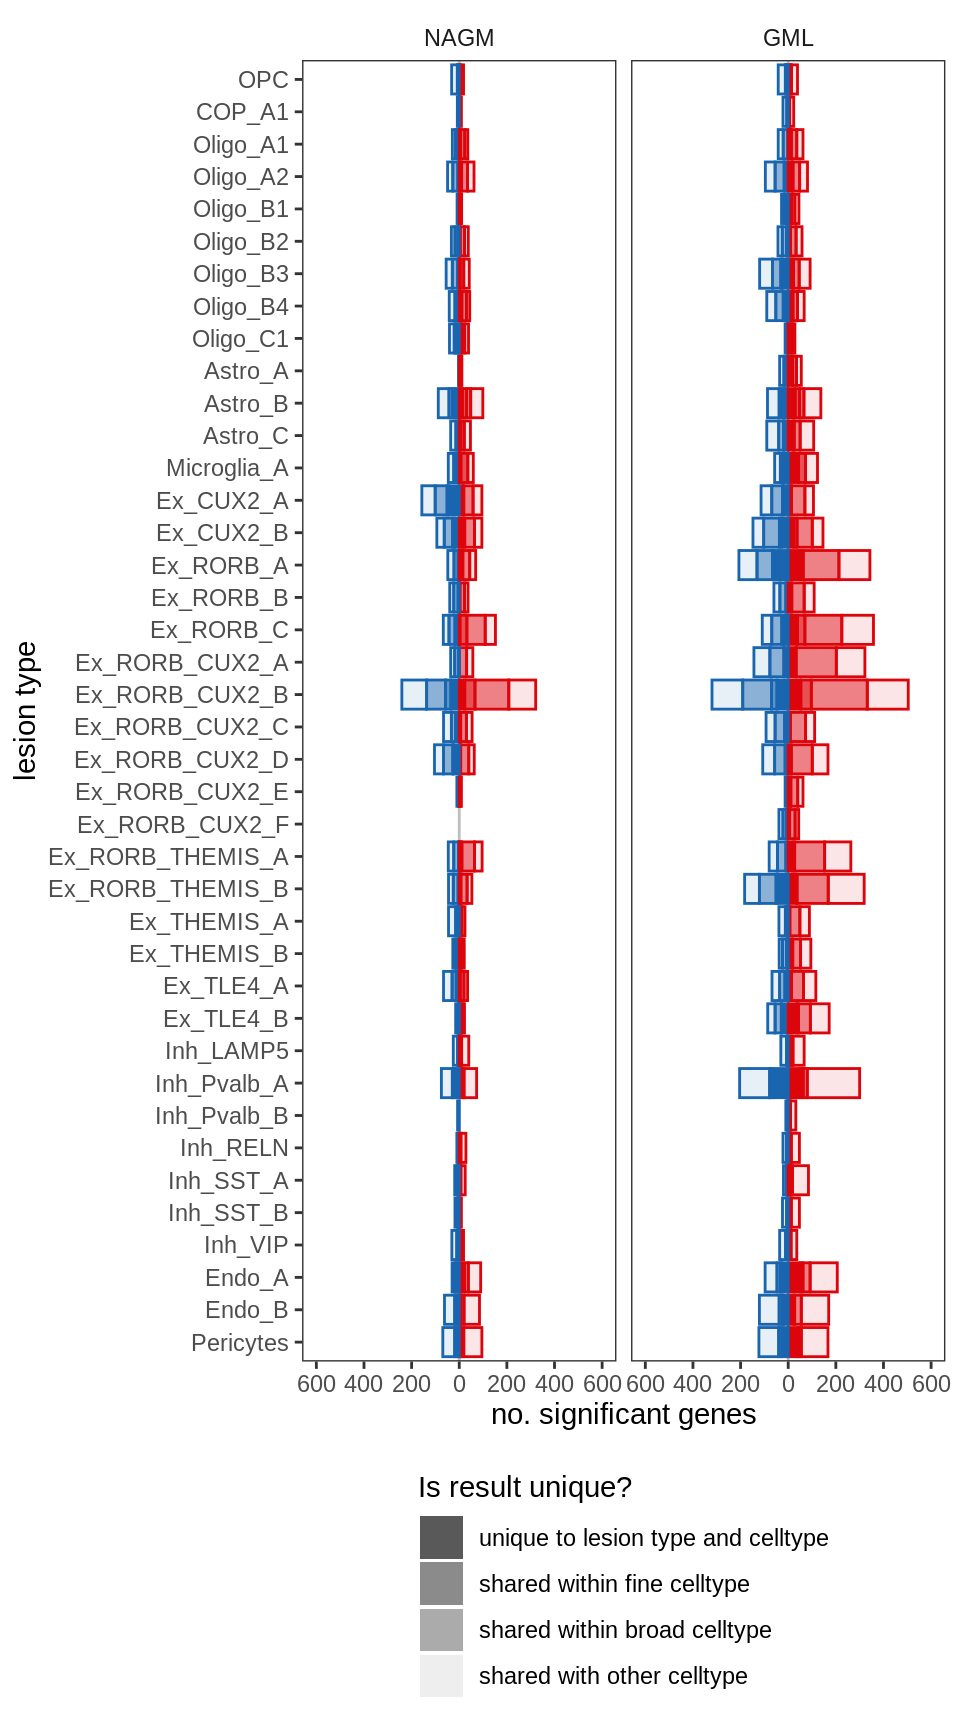
ED4b
include_graphics("figure/ms99_deg_figures_wm.Rmd/plot_de_barplot_fine-1.png", error = FALSE)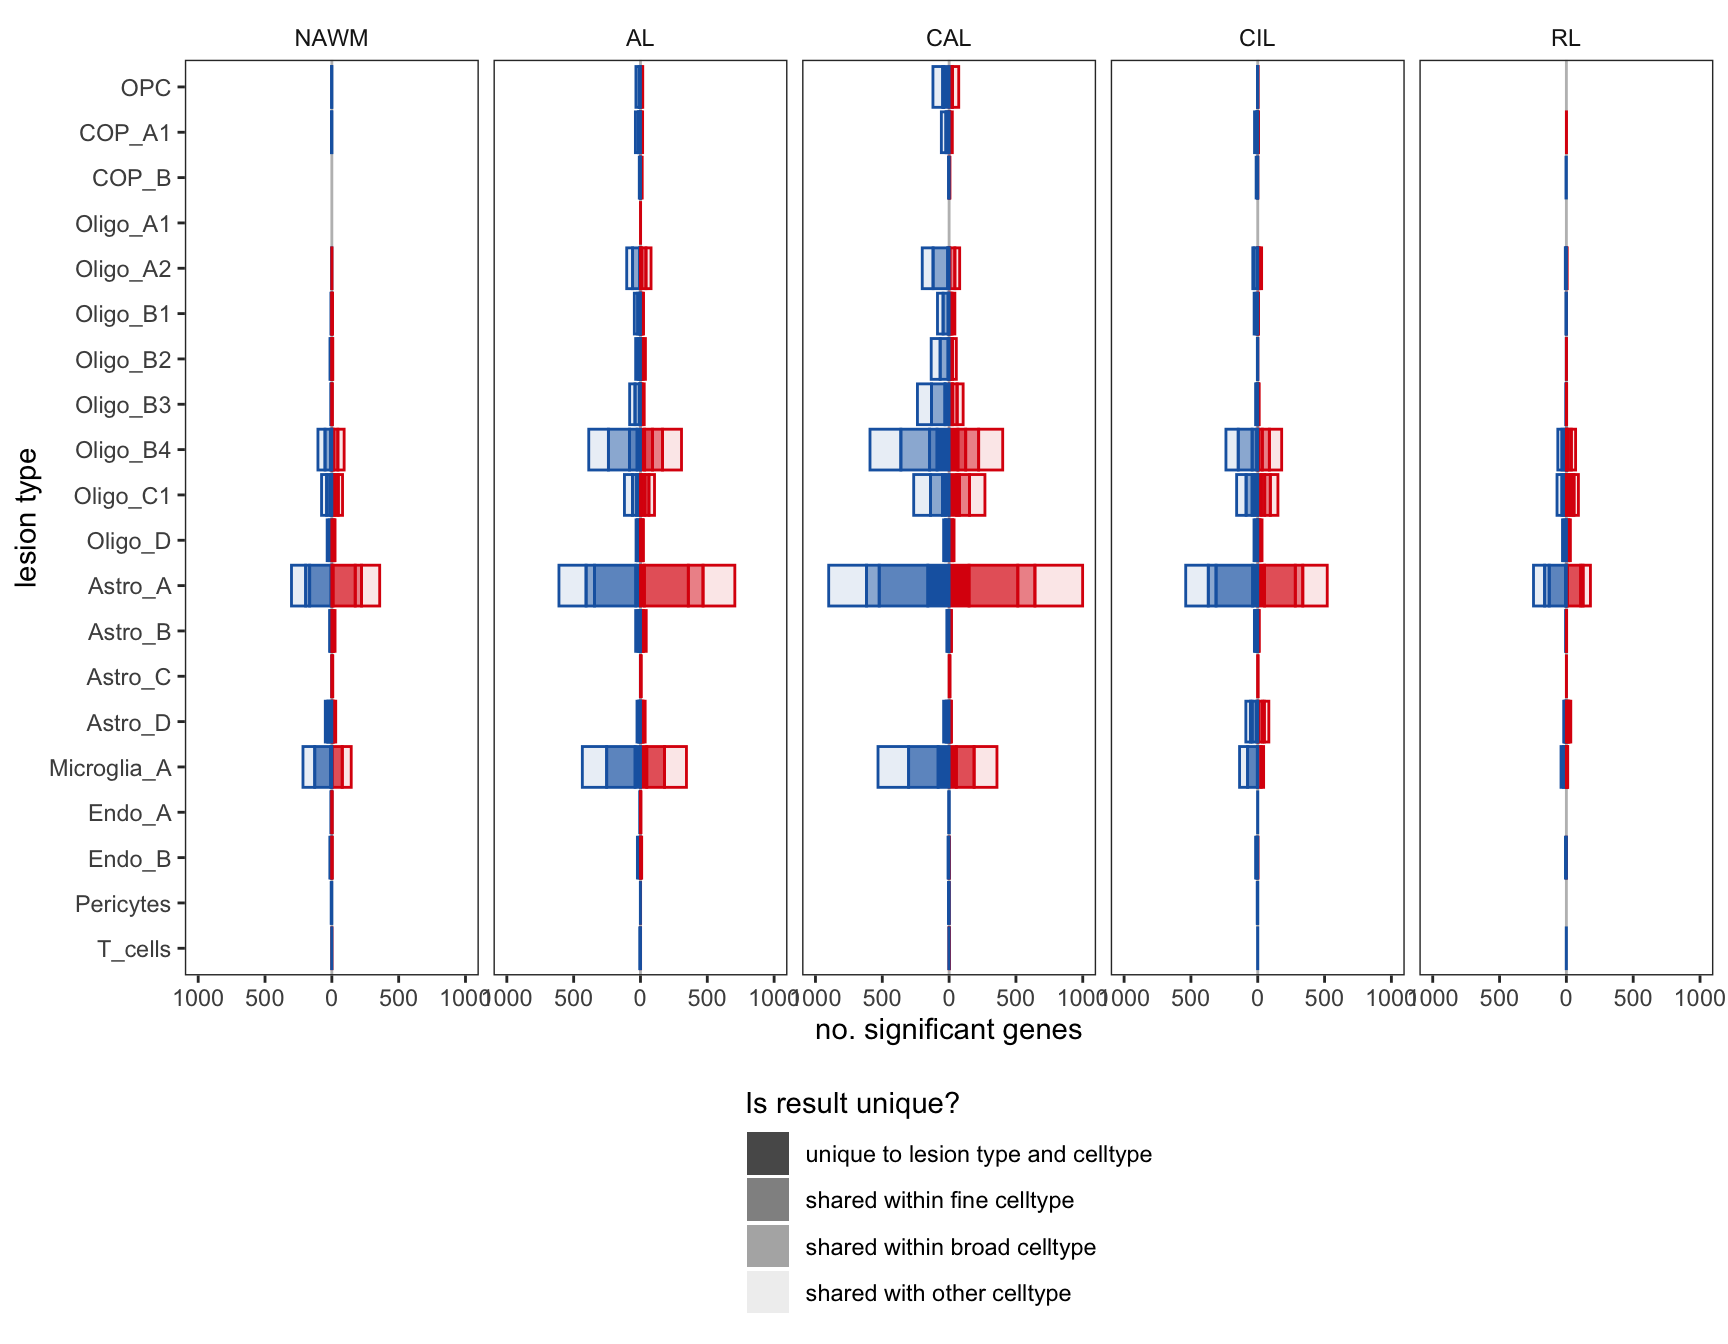
ED5a
Cartoon giving intuition of how MOFA+ identifies tissue-level factors.
include_graphics("figure/additional_figures/mofa_cartoon_2022-02-04.png", error = FALSE)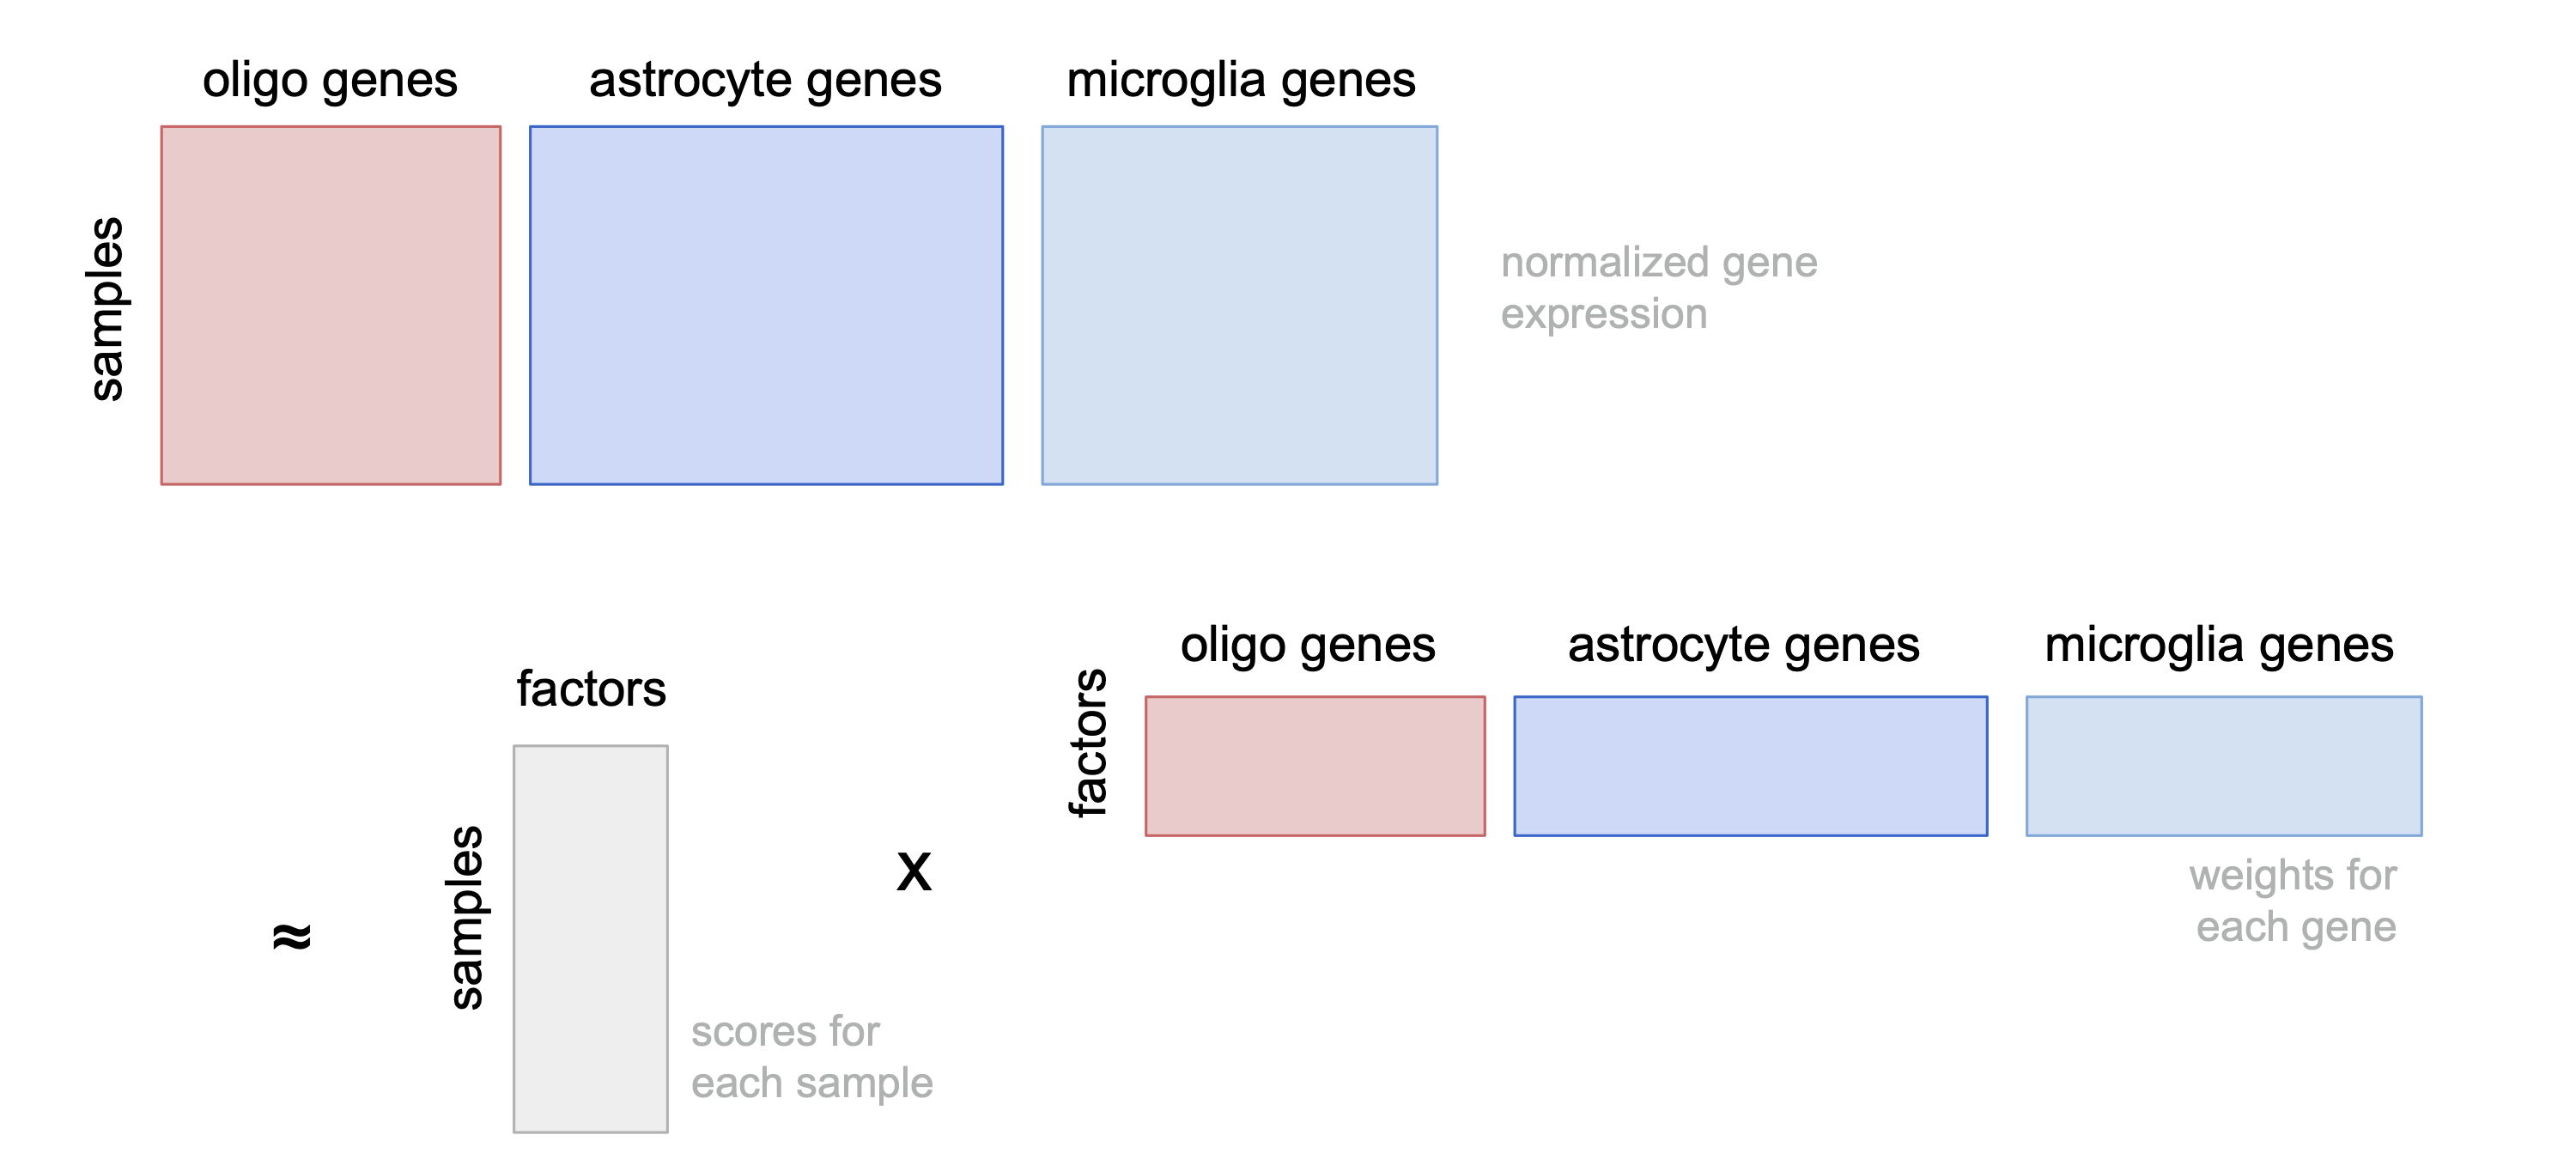
ED5b
First panel shows variation in expression for each celltype explained by MOFA+ factors in GM; second panel shows extent to which MOFA+ factors can be accounted for by metadata. Variance explained in first panel is per celltype, so the maximum total for each row is 100%. Pseudo-R2 values are calculated by fitting a mixed model to each factor, using model factor_value ~ lesion_type + sex + age_scale + pmi_cat + (1 | donor_id), and the glmmTMB function in package glmmTMB. Pseudo-R2 values are determined by Nakagawa’s R2, showing proportion of variance explained using fixed components only, and including a donor effect (see Methods).
include_graphics("figure/ms15_mofa_gm_edger_libs.Rmd/fig_factor_r2s-1.png", error = FALSE)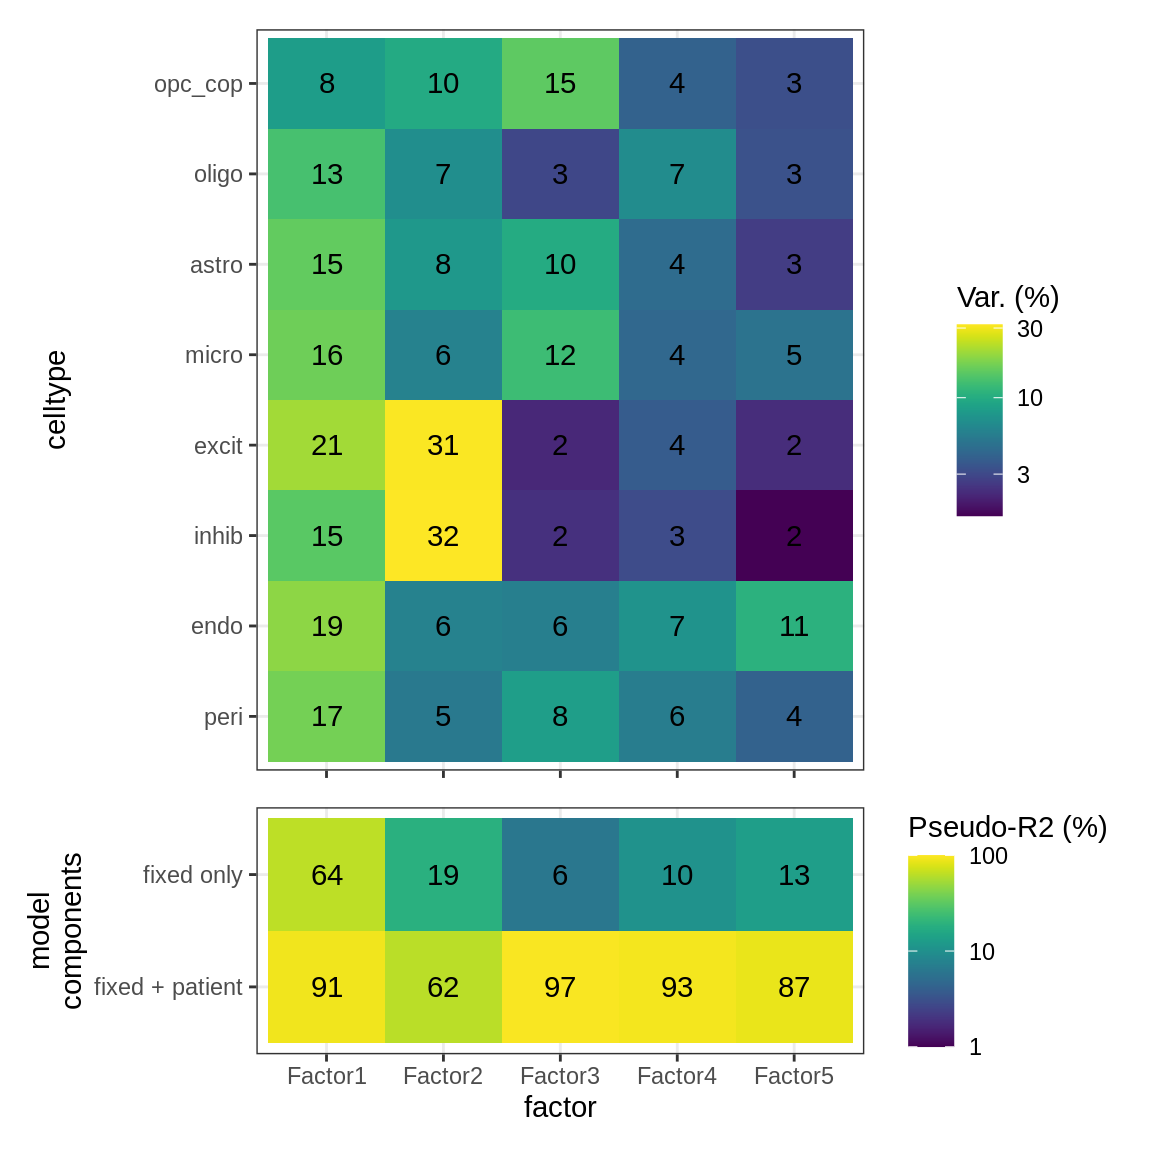
ED5c
As for S5B, for WM.
include_graphics("figure/ms15_mofa_wm_edger_libs.Rmd/fig_factor_r2s-1.png", error = FALSE)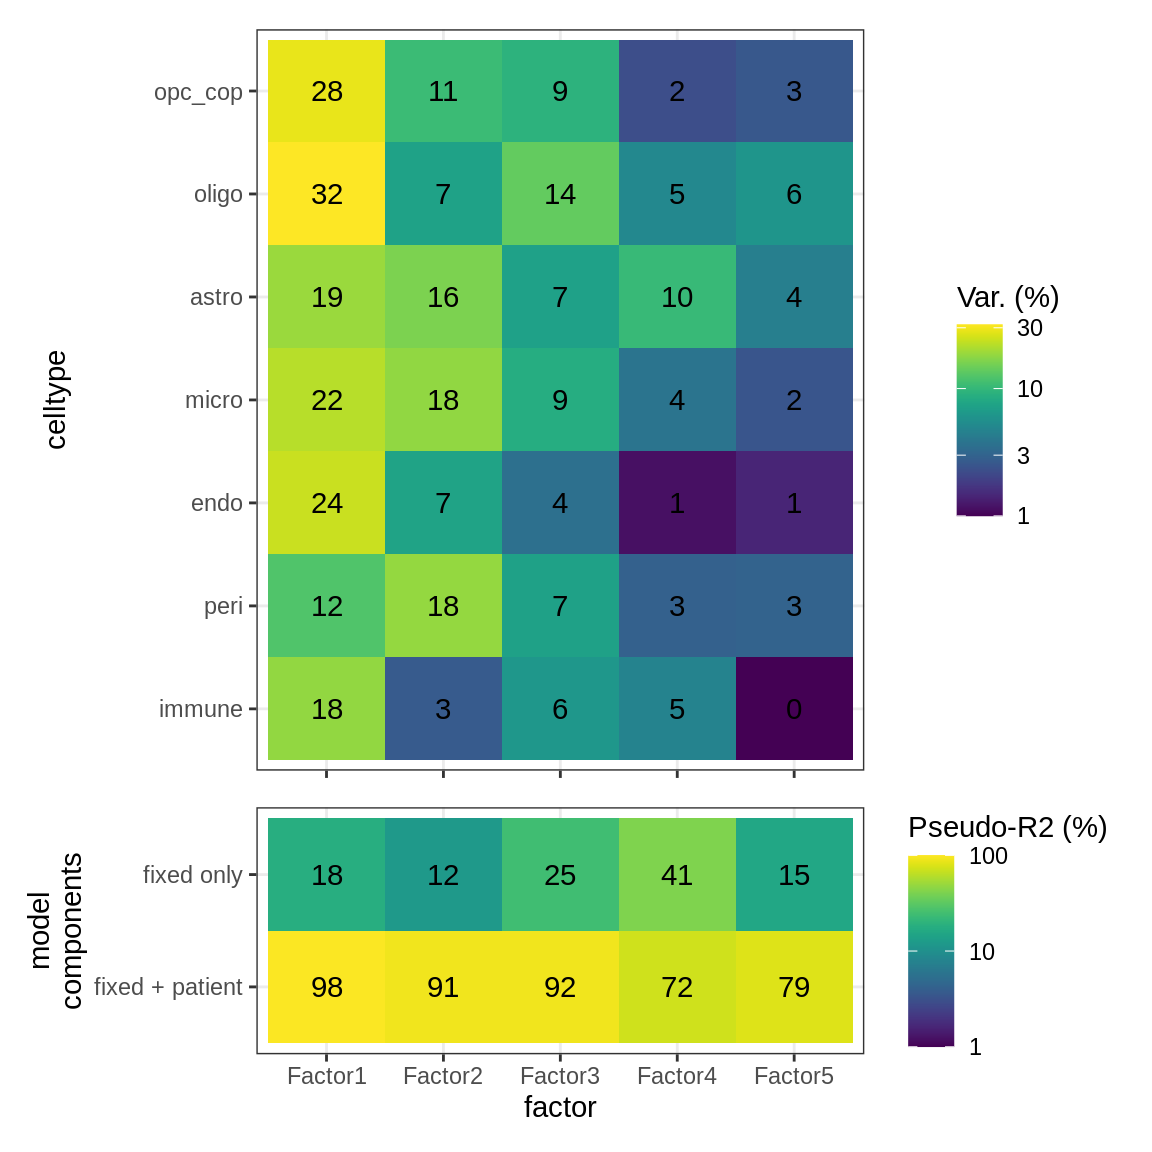
ED5d
Distributions of MOFA factors in GM. Colour denotes donor; grey is used where only one sample was obtained from a donor.
include_graphics("figure/ms15_mofa_gm_edger_libs.Rmd/fig_mofa_factors_lesions-1.png", error = FALSE)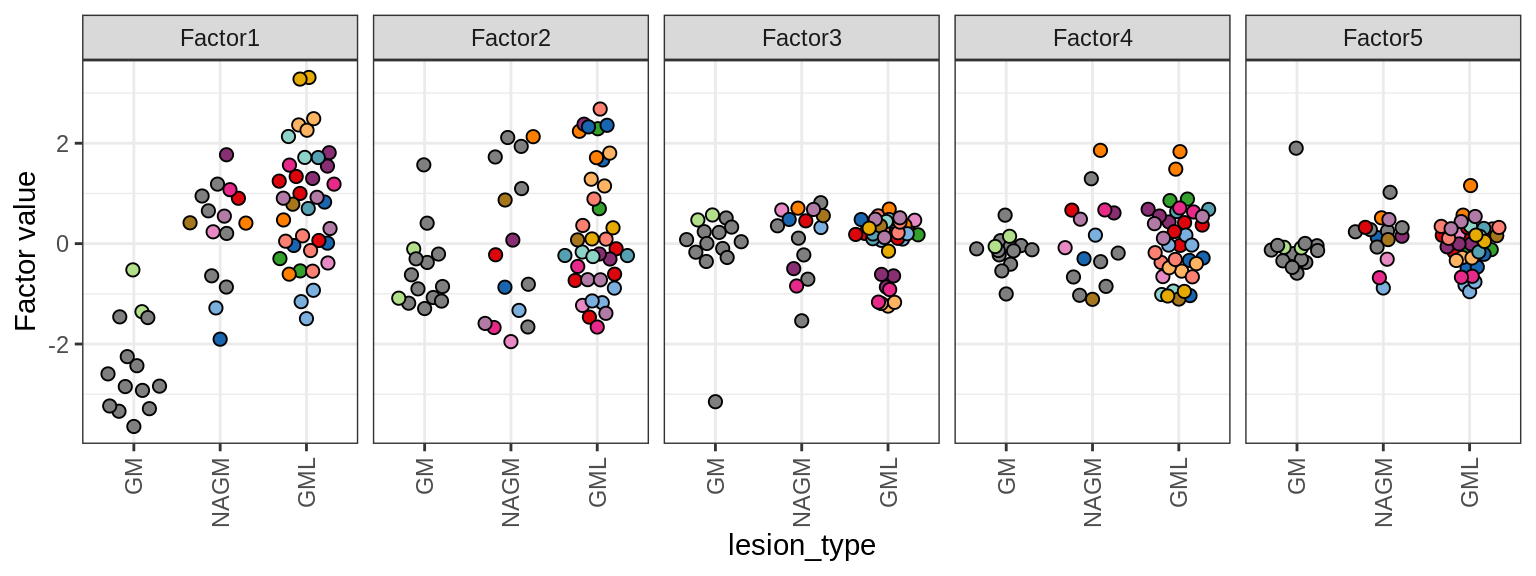
ED5e
Factor 1 top genes in GM.
include_graphics("figure/ms15_mofa_gm_edger_libs.Rmd/fig_factor1-1.png", error = FALSE)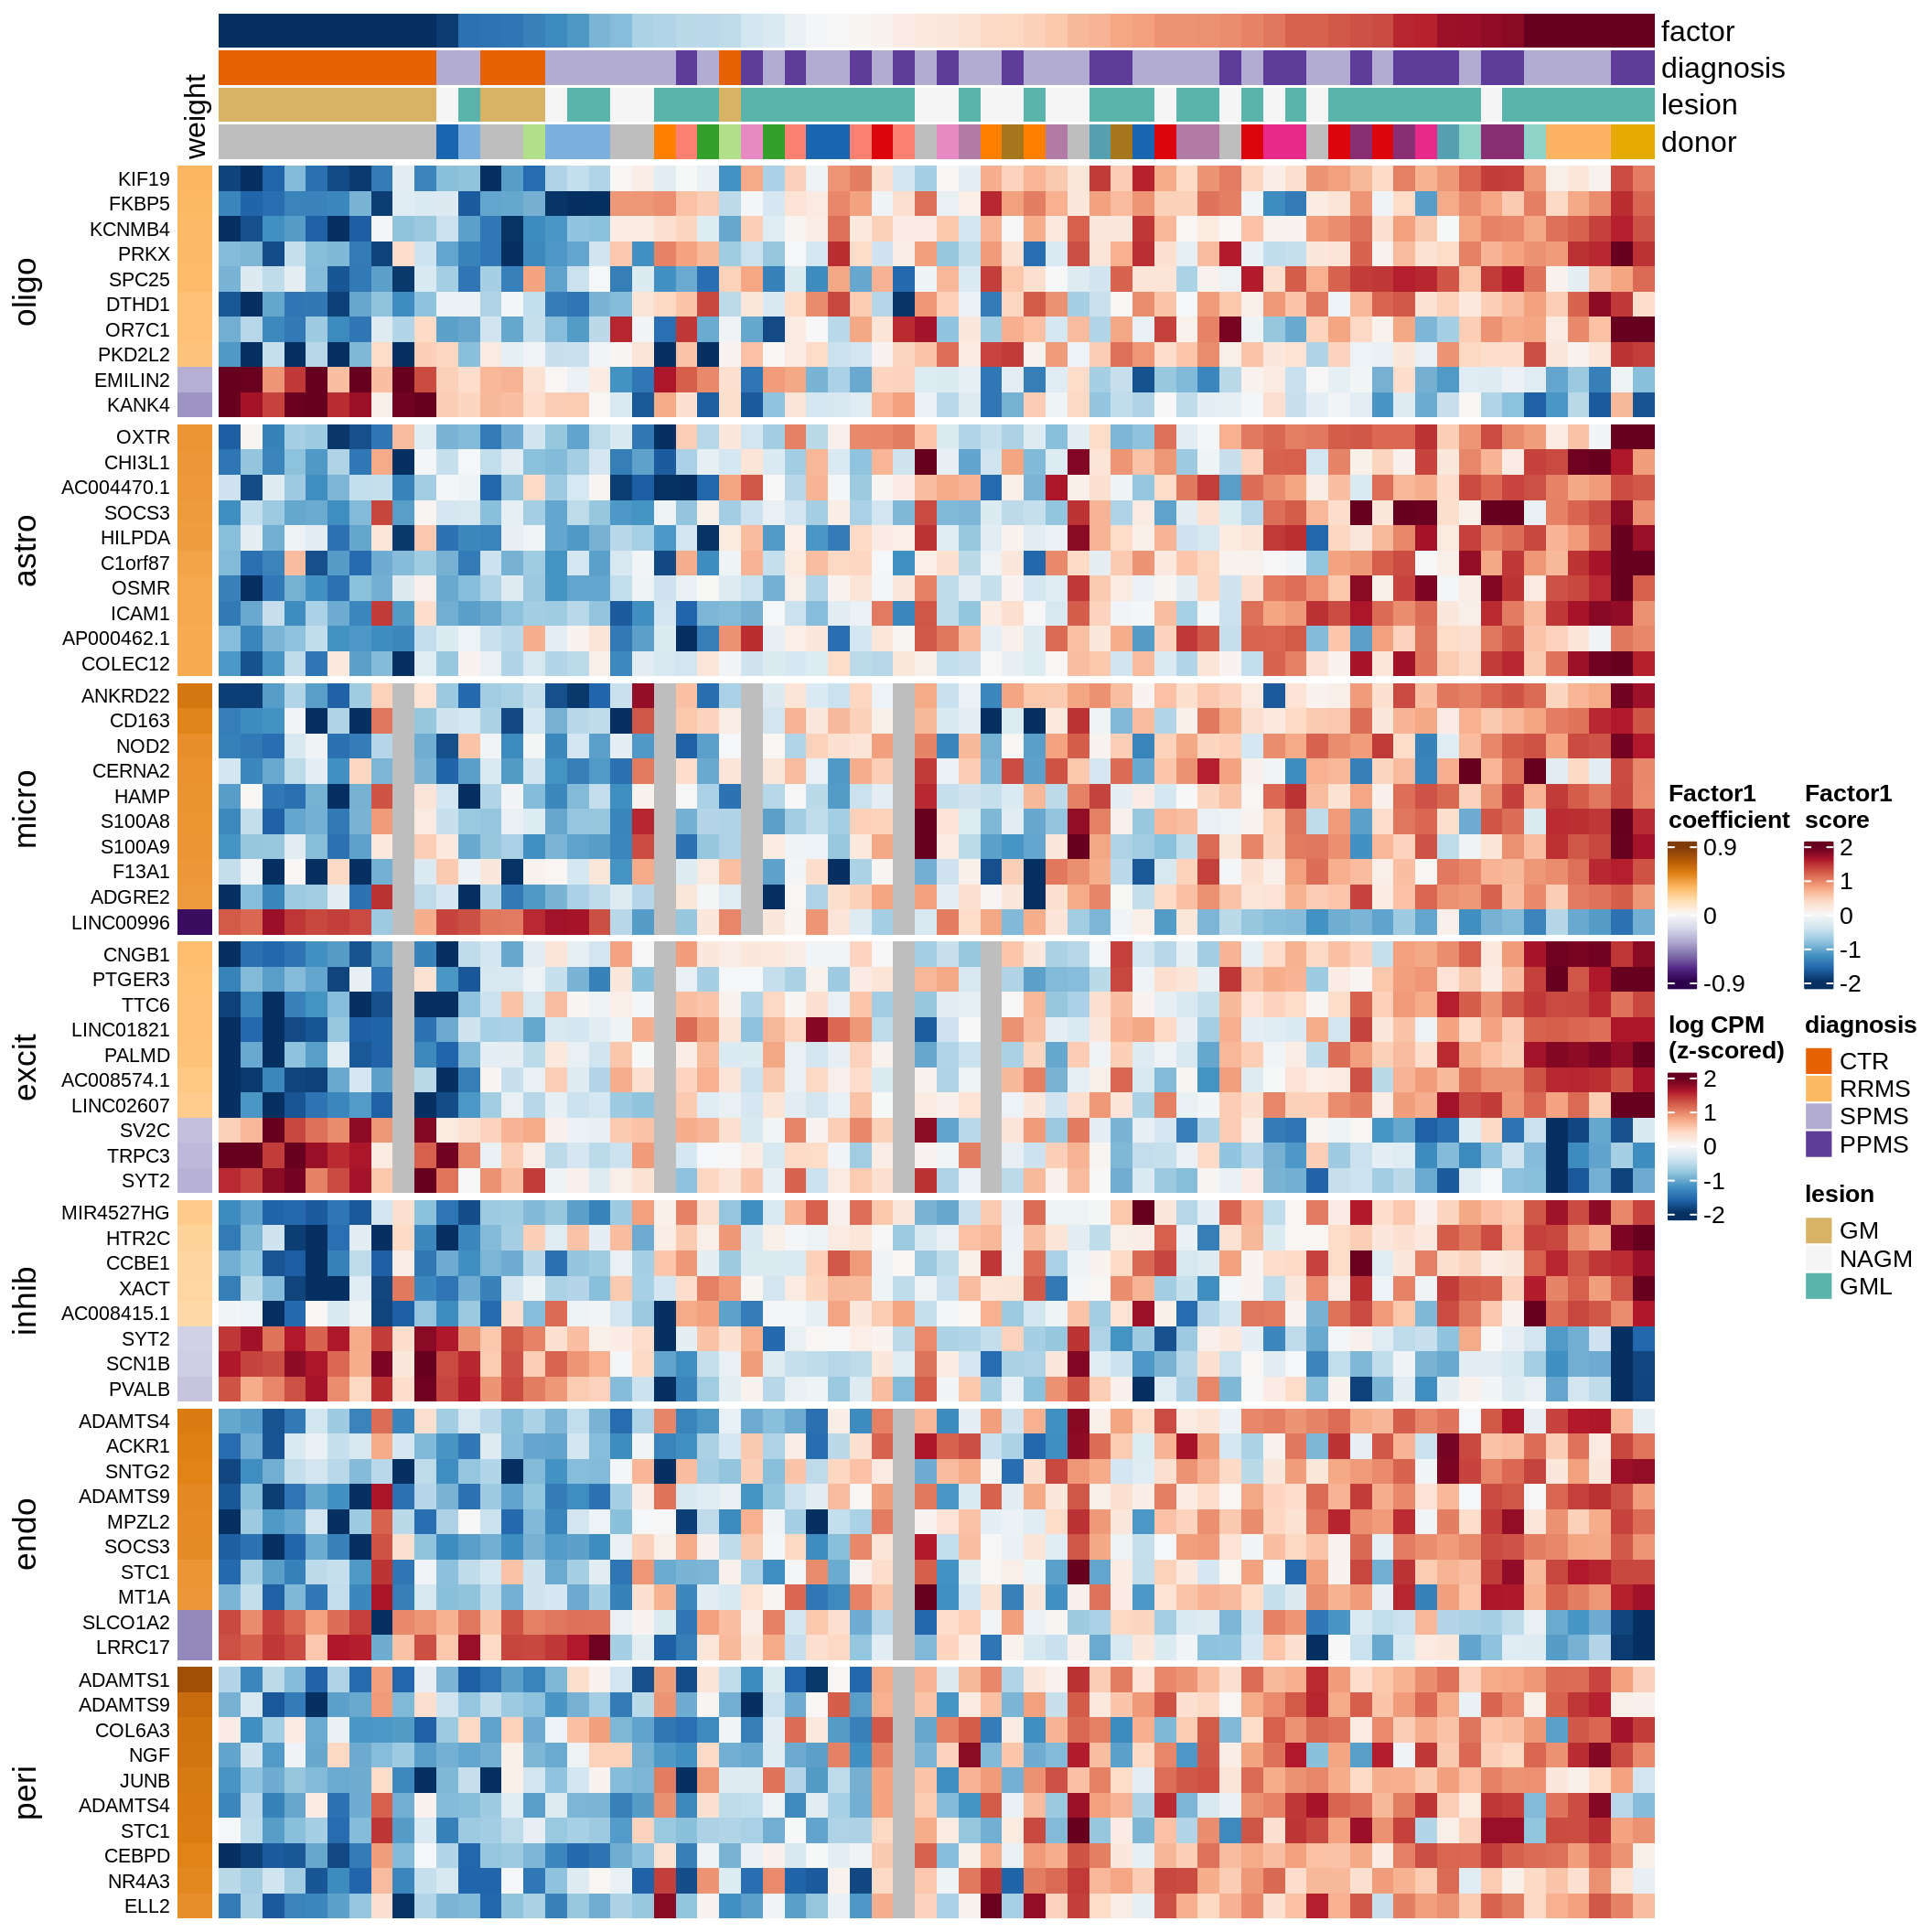
ED5f
Pairwise distributions of MOFA factors in GM. Colour denotes donor; grey is used where only one sample was obtained from a donor.
include_graphics("figure/ms15_mofa_gm_edger_libs.Rmd/plot_factors_pairwise-1.png", error = FALSE)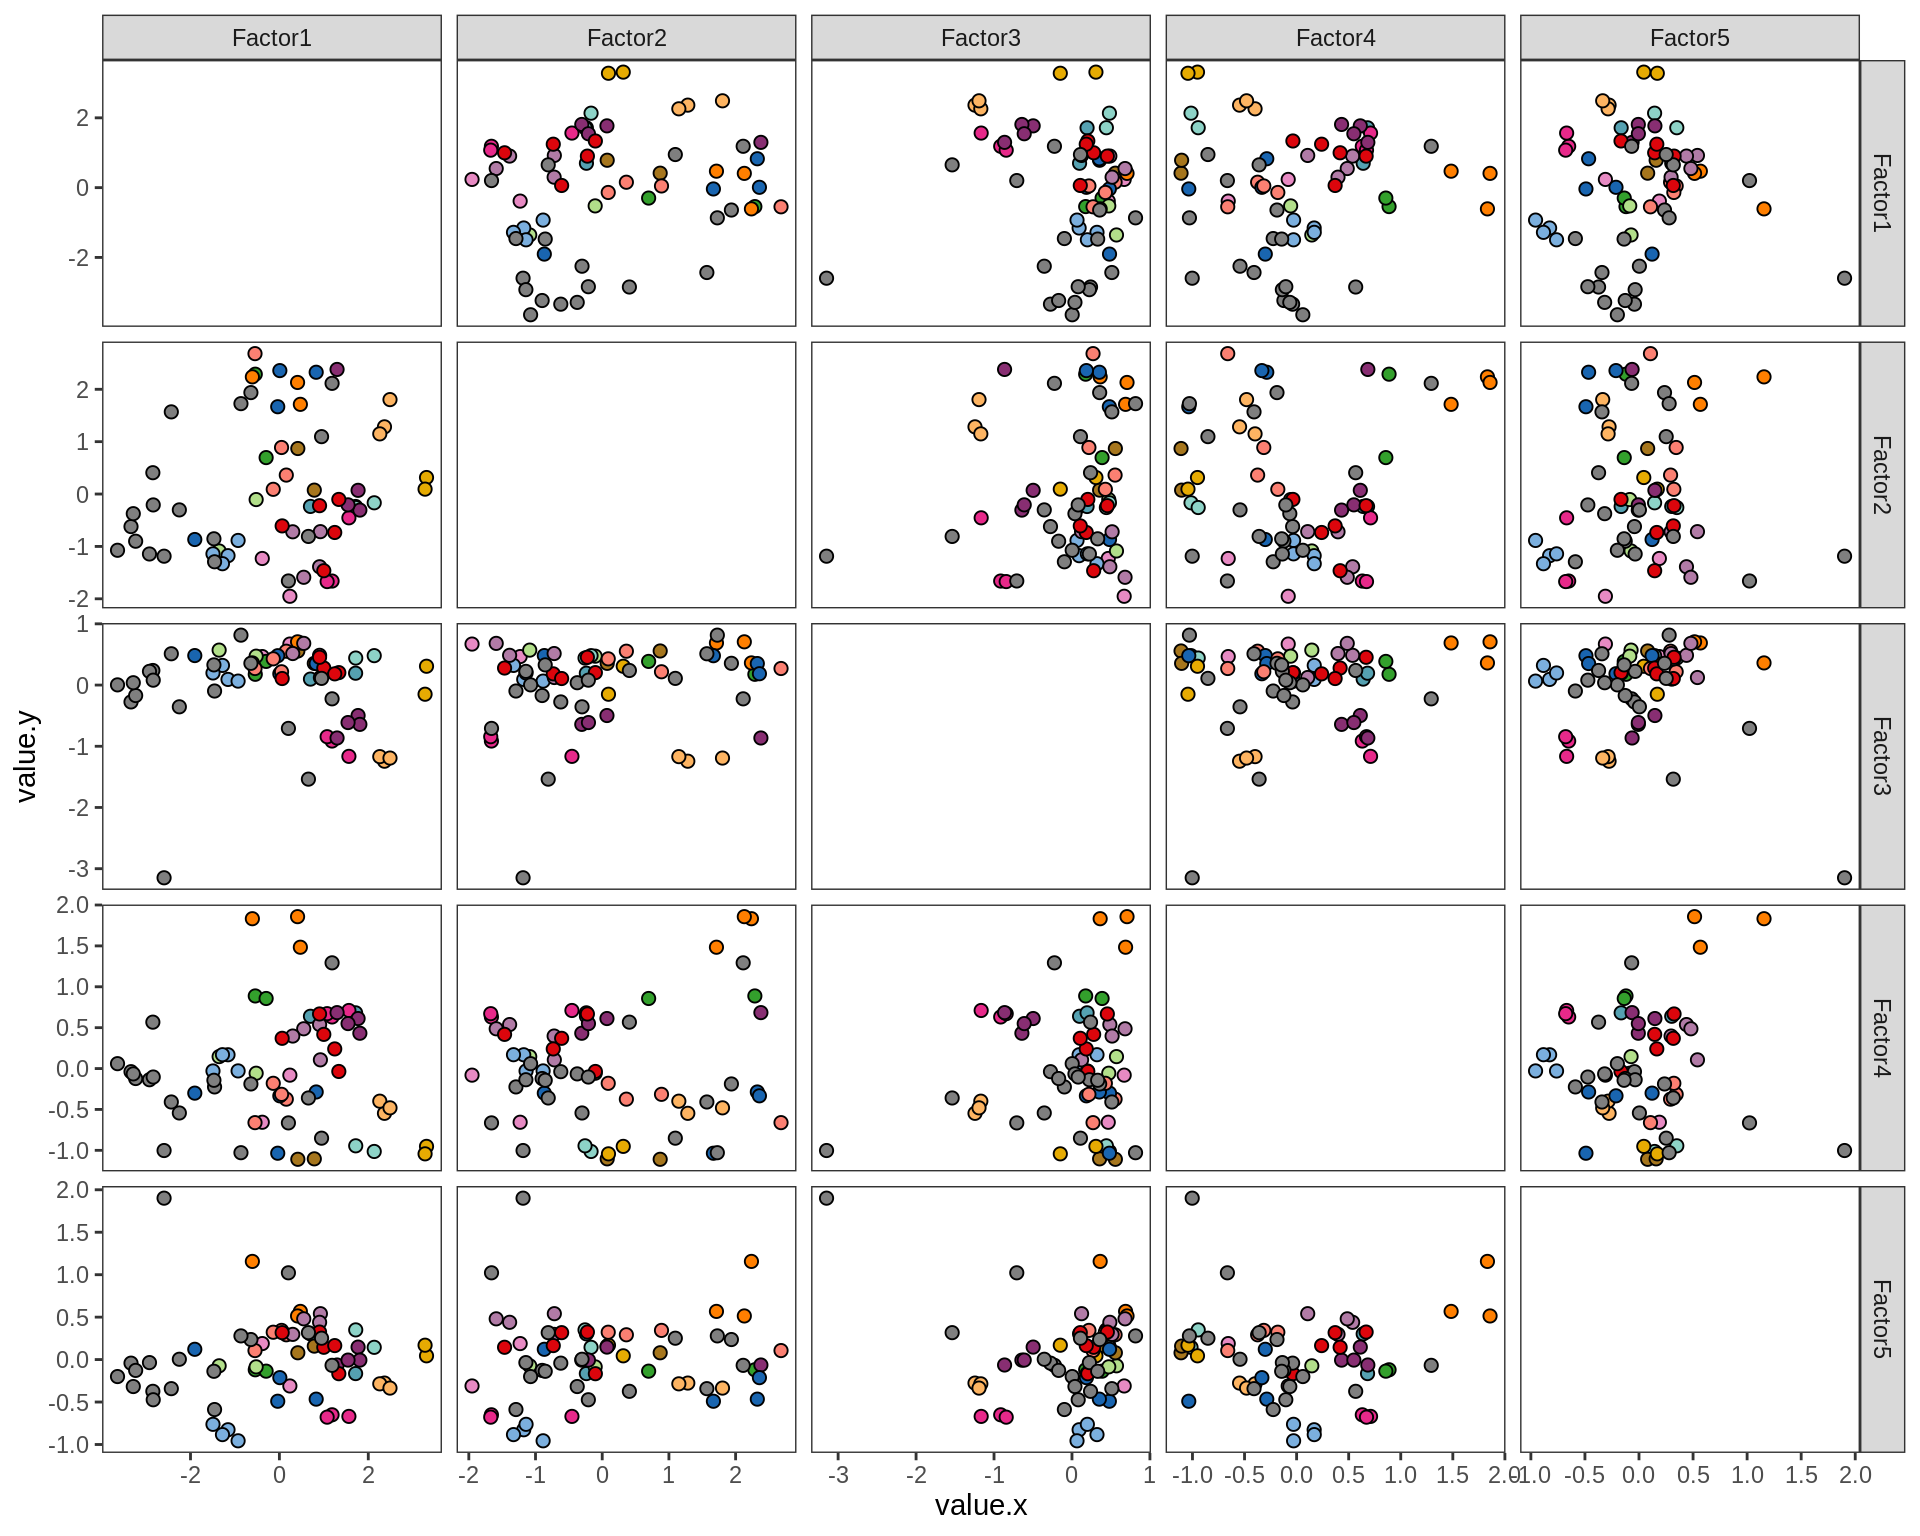
ED5g
Pairwise distributions of MOFA factors in WM. Colour denotes donor; grey is used where only one sample was obtained from a donor.
include_graphics("figure/ms15_mofa_wm_edger_libs.Rmd/plot_factors_pairwise-1.png", error = FALSE)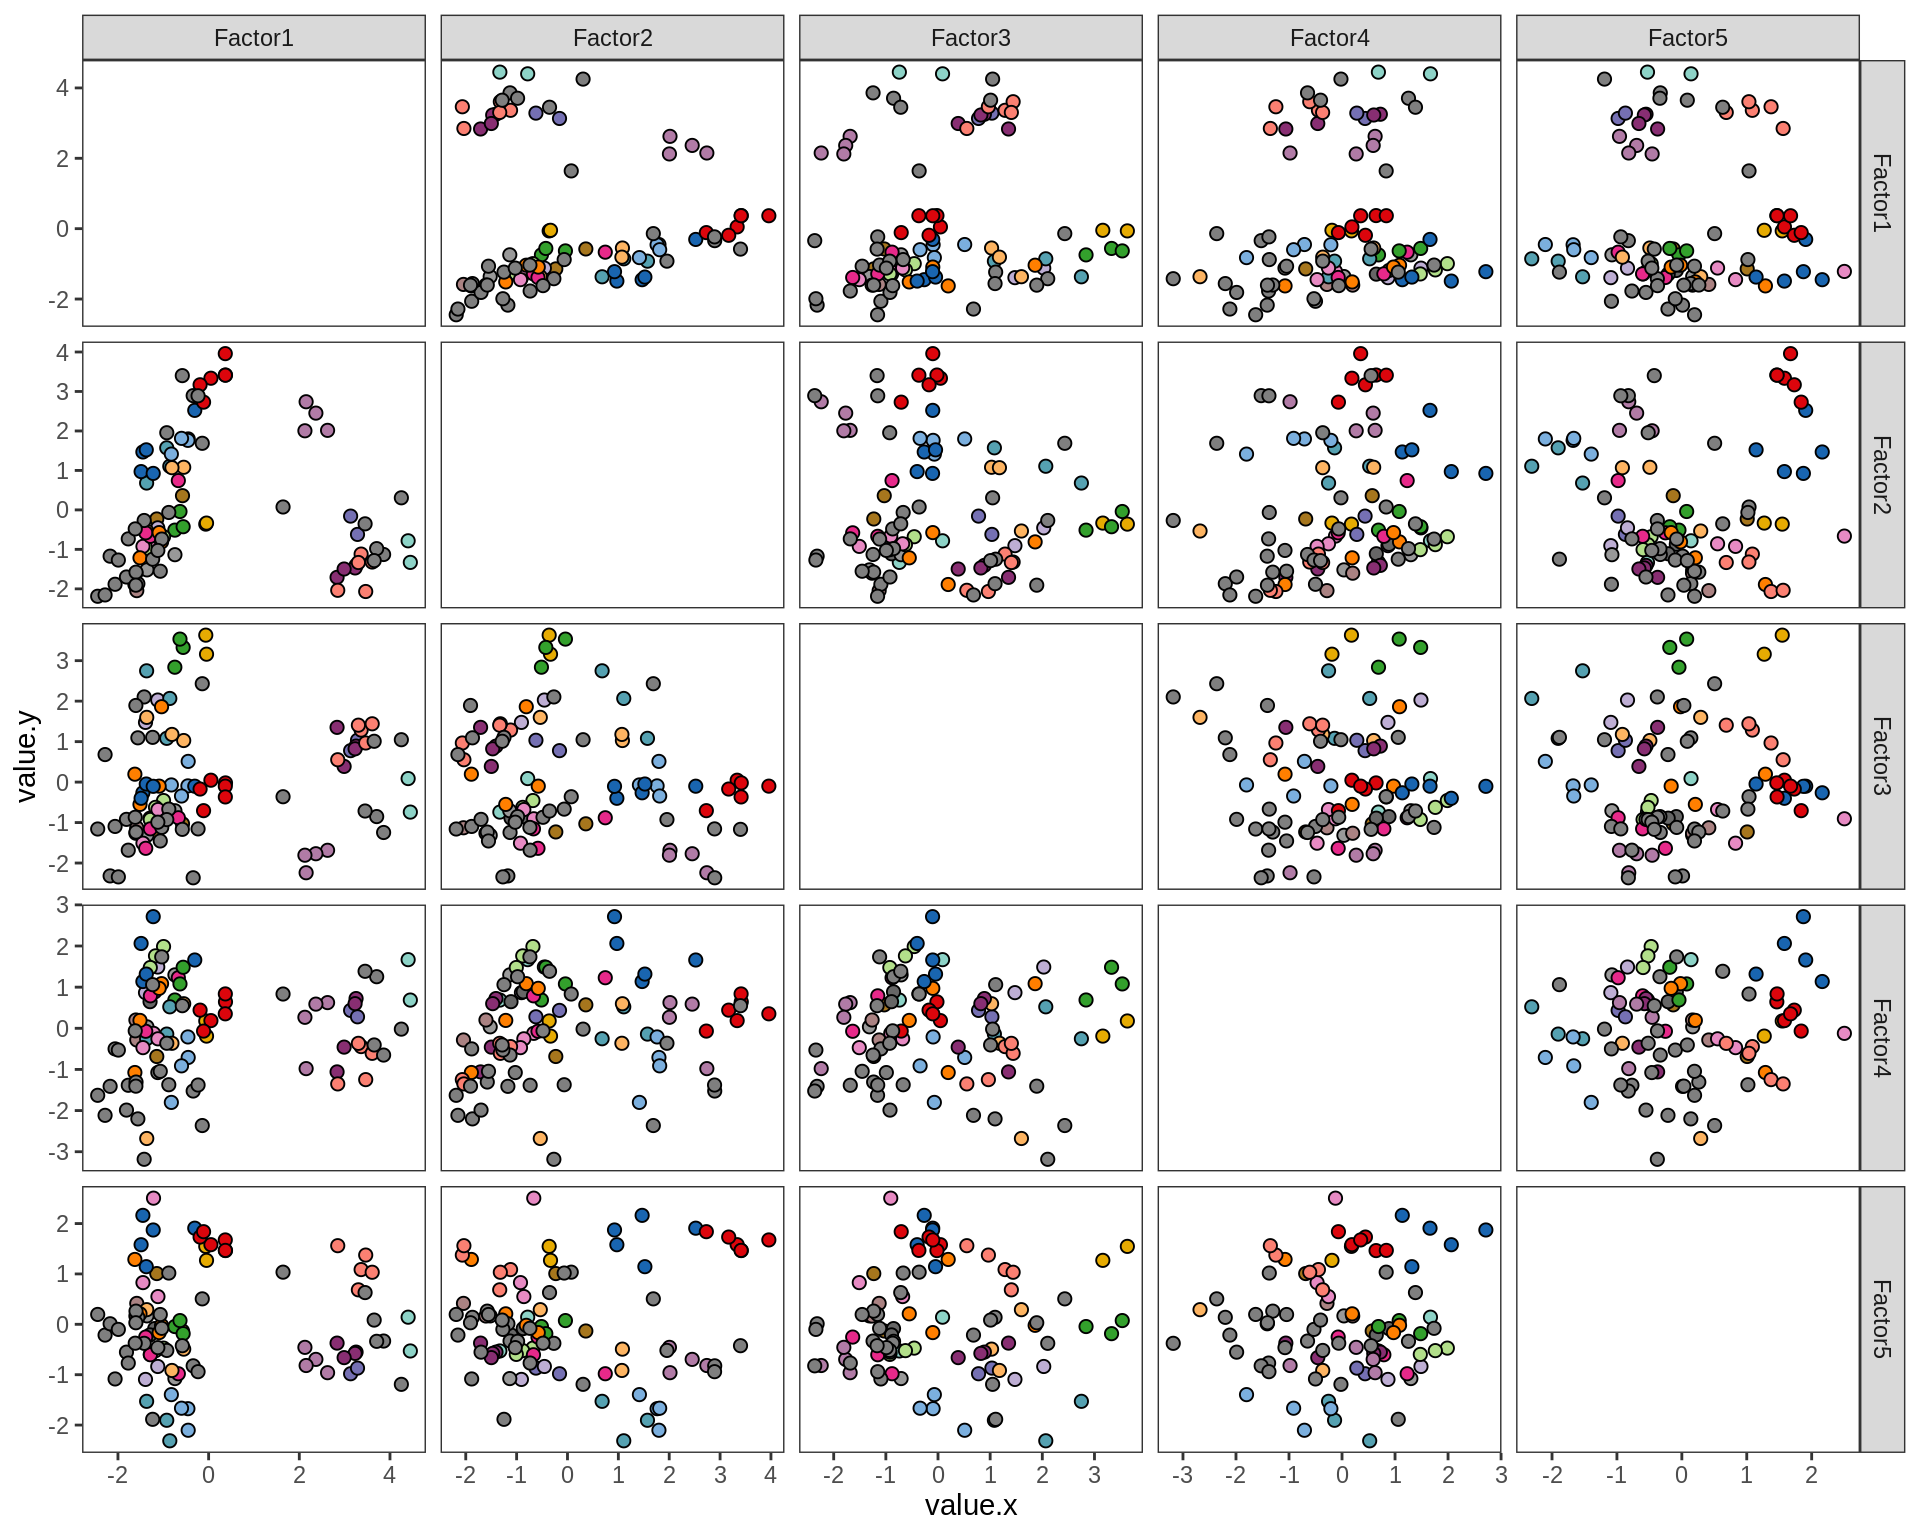
ED6a
Upper Proportions of fine celltypes in healthy GM and healthy WM. Neuronal celltypes excluded. Negative binomial model fit to absolute numbers for each celltype, using total number of cells in sample as offset. FDR calculated across all celltypes. Lower Absolute numbers.
include_graphics("figure/ms09_ancombc_mixed.Rmd/plot_wm_vs_gm_absolute-1.png", error = FALSE)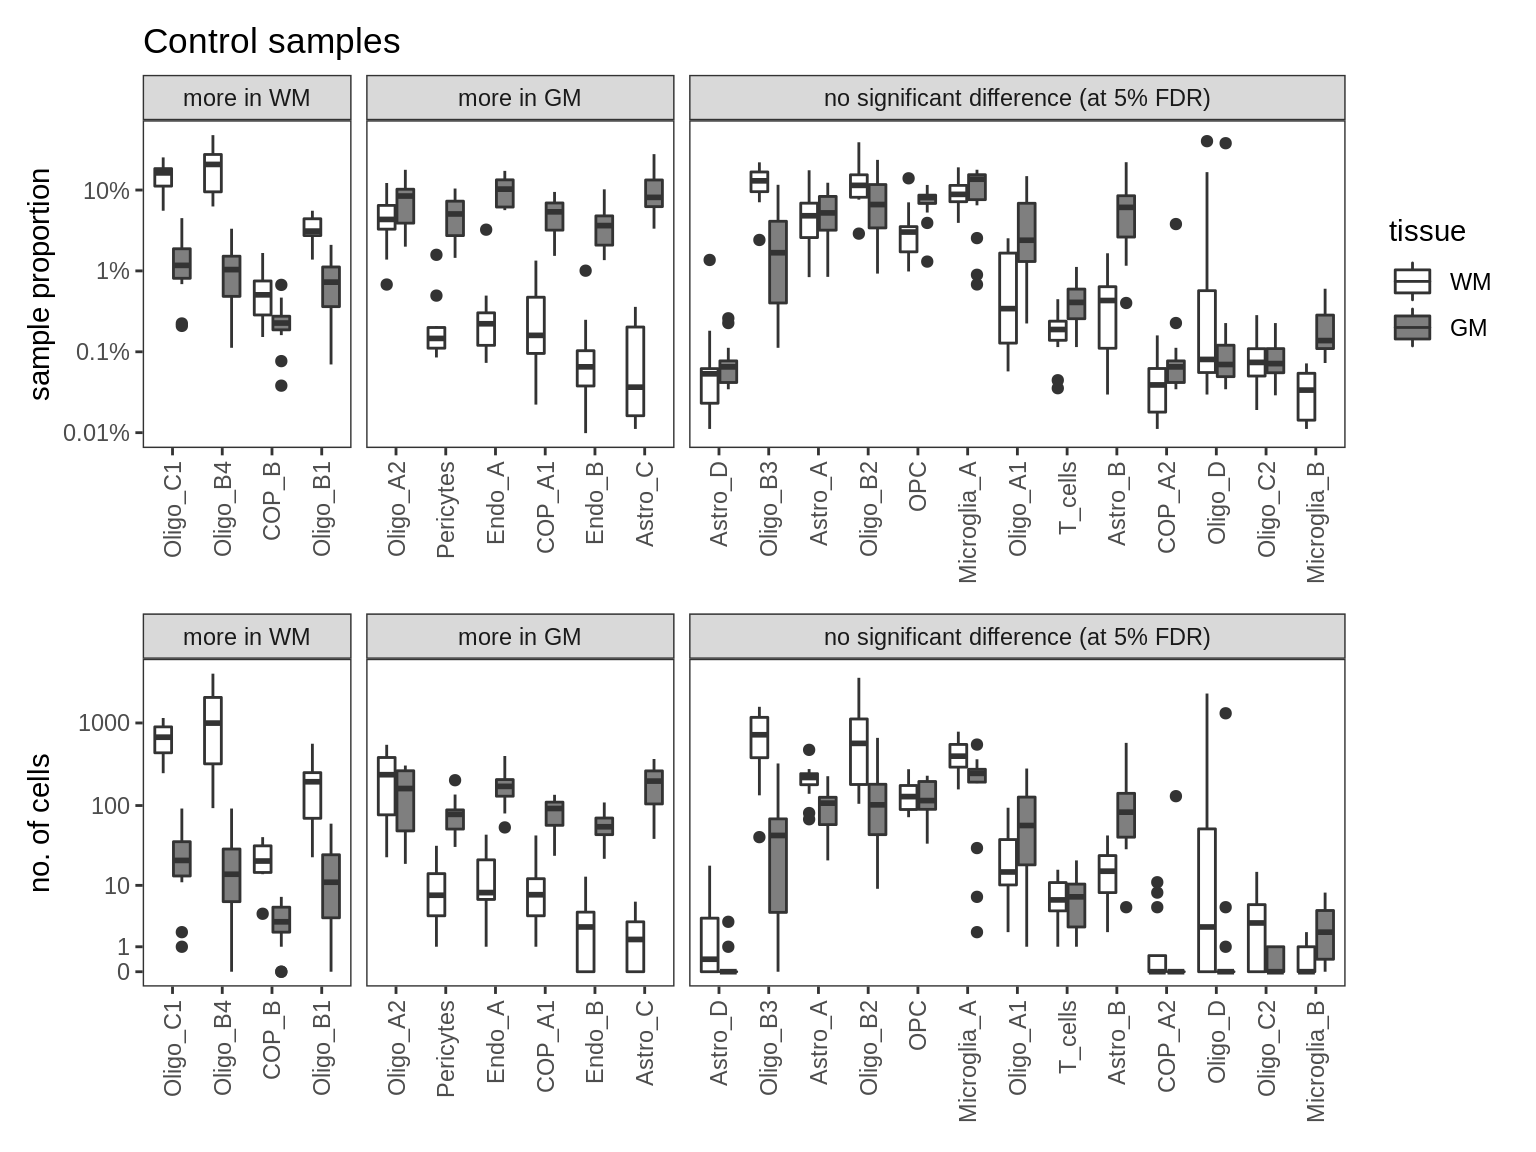
| Version | Author | Date |
|---|---|---|
| 5c9901d | Macnair | 2022-04-05 |
ED6b
Median oNMF module score per fine celltype for microglial and immune modules and cells. Columns are scaled to have max value equal to 1.
include_graphics("figure/ms08_modules.Rmd/plot_scores_by_type_scaled-2.png", error = FALSE)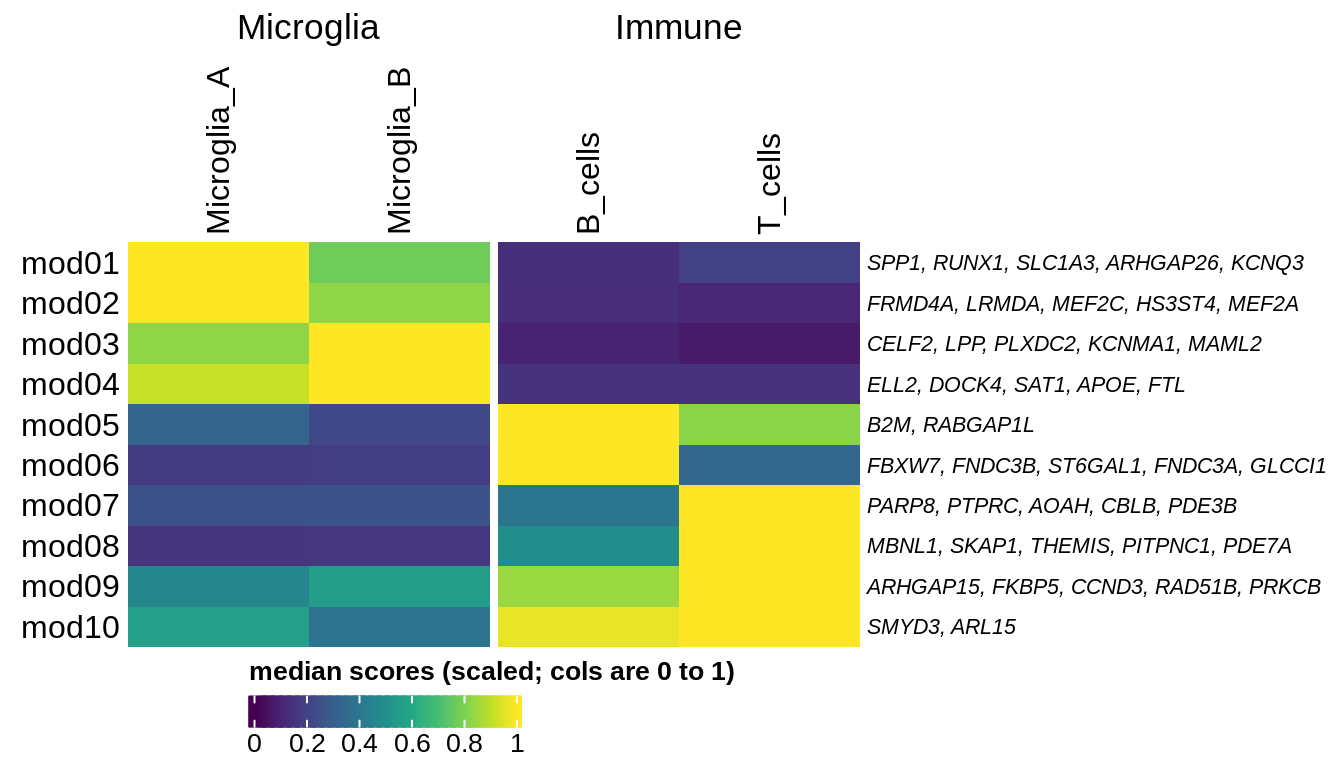
ED6c
Differential abundance of WM lesion samples against control WM, as calculated by bootstrapped ANCOM-BC. Left Dashed line at 0 corresponds to no difference between control and lesion. Model fitted is count ~ lesion_type + sex + age_scale + pmi_cat (where age_scale is age at death, normalized to have SD = 0.5). Point corresponds to median log2FC effect estimated by ANCOM-BC; coloured range is 80% bootstrapped confidence interval, grey range is 95% CI. Points are filled when the 95% CI excludes zero; otherwise empty. Cell type called as significant when at the 95% CI excludes 0 for at least one lesion. Right Boxplots of absolute numbers cell types in left plot. Boxplots (and outlier dots) show range of total numbers of this cell type observed across samples.
include_graphics("figure/ms09_ancombc_mixed.Rmd/plot_bootstraps_lesions-1.png", error = FALSE)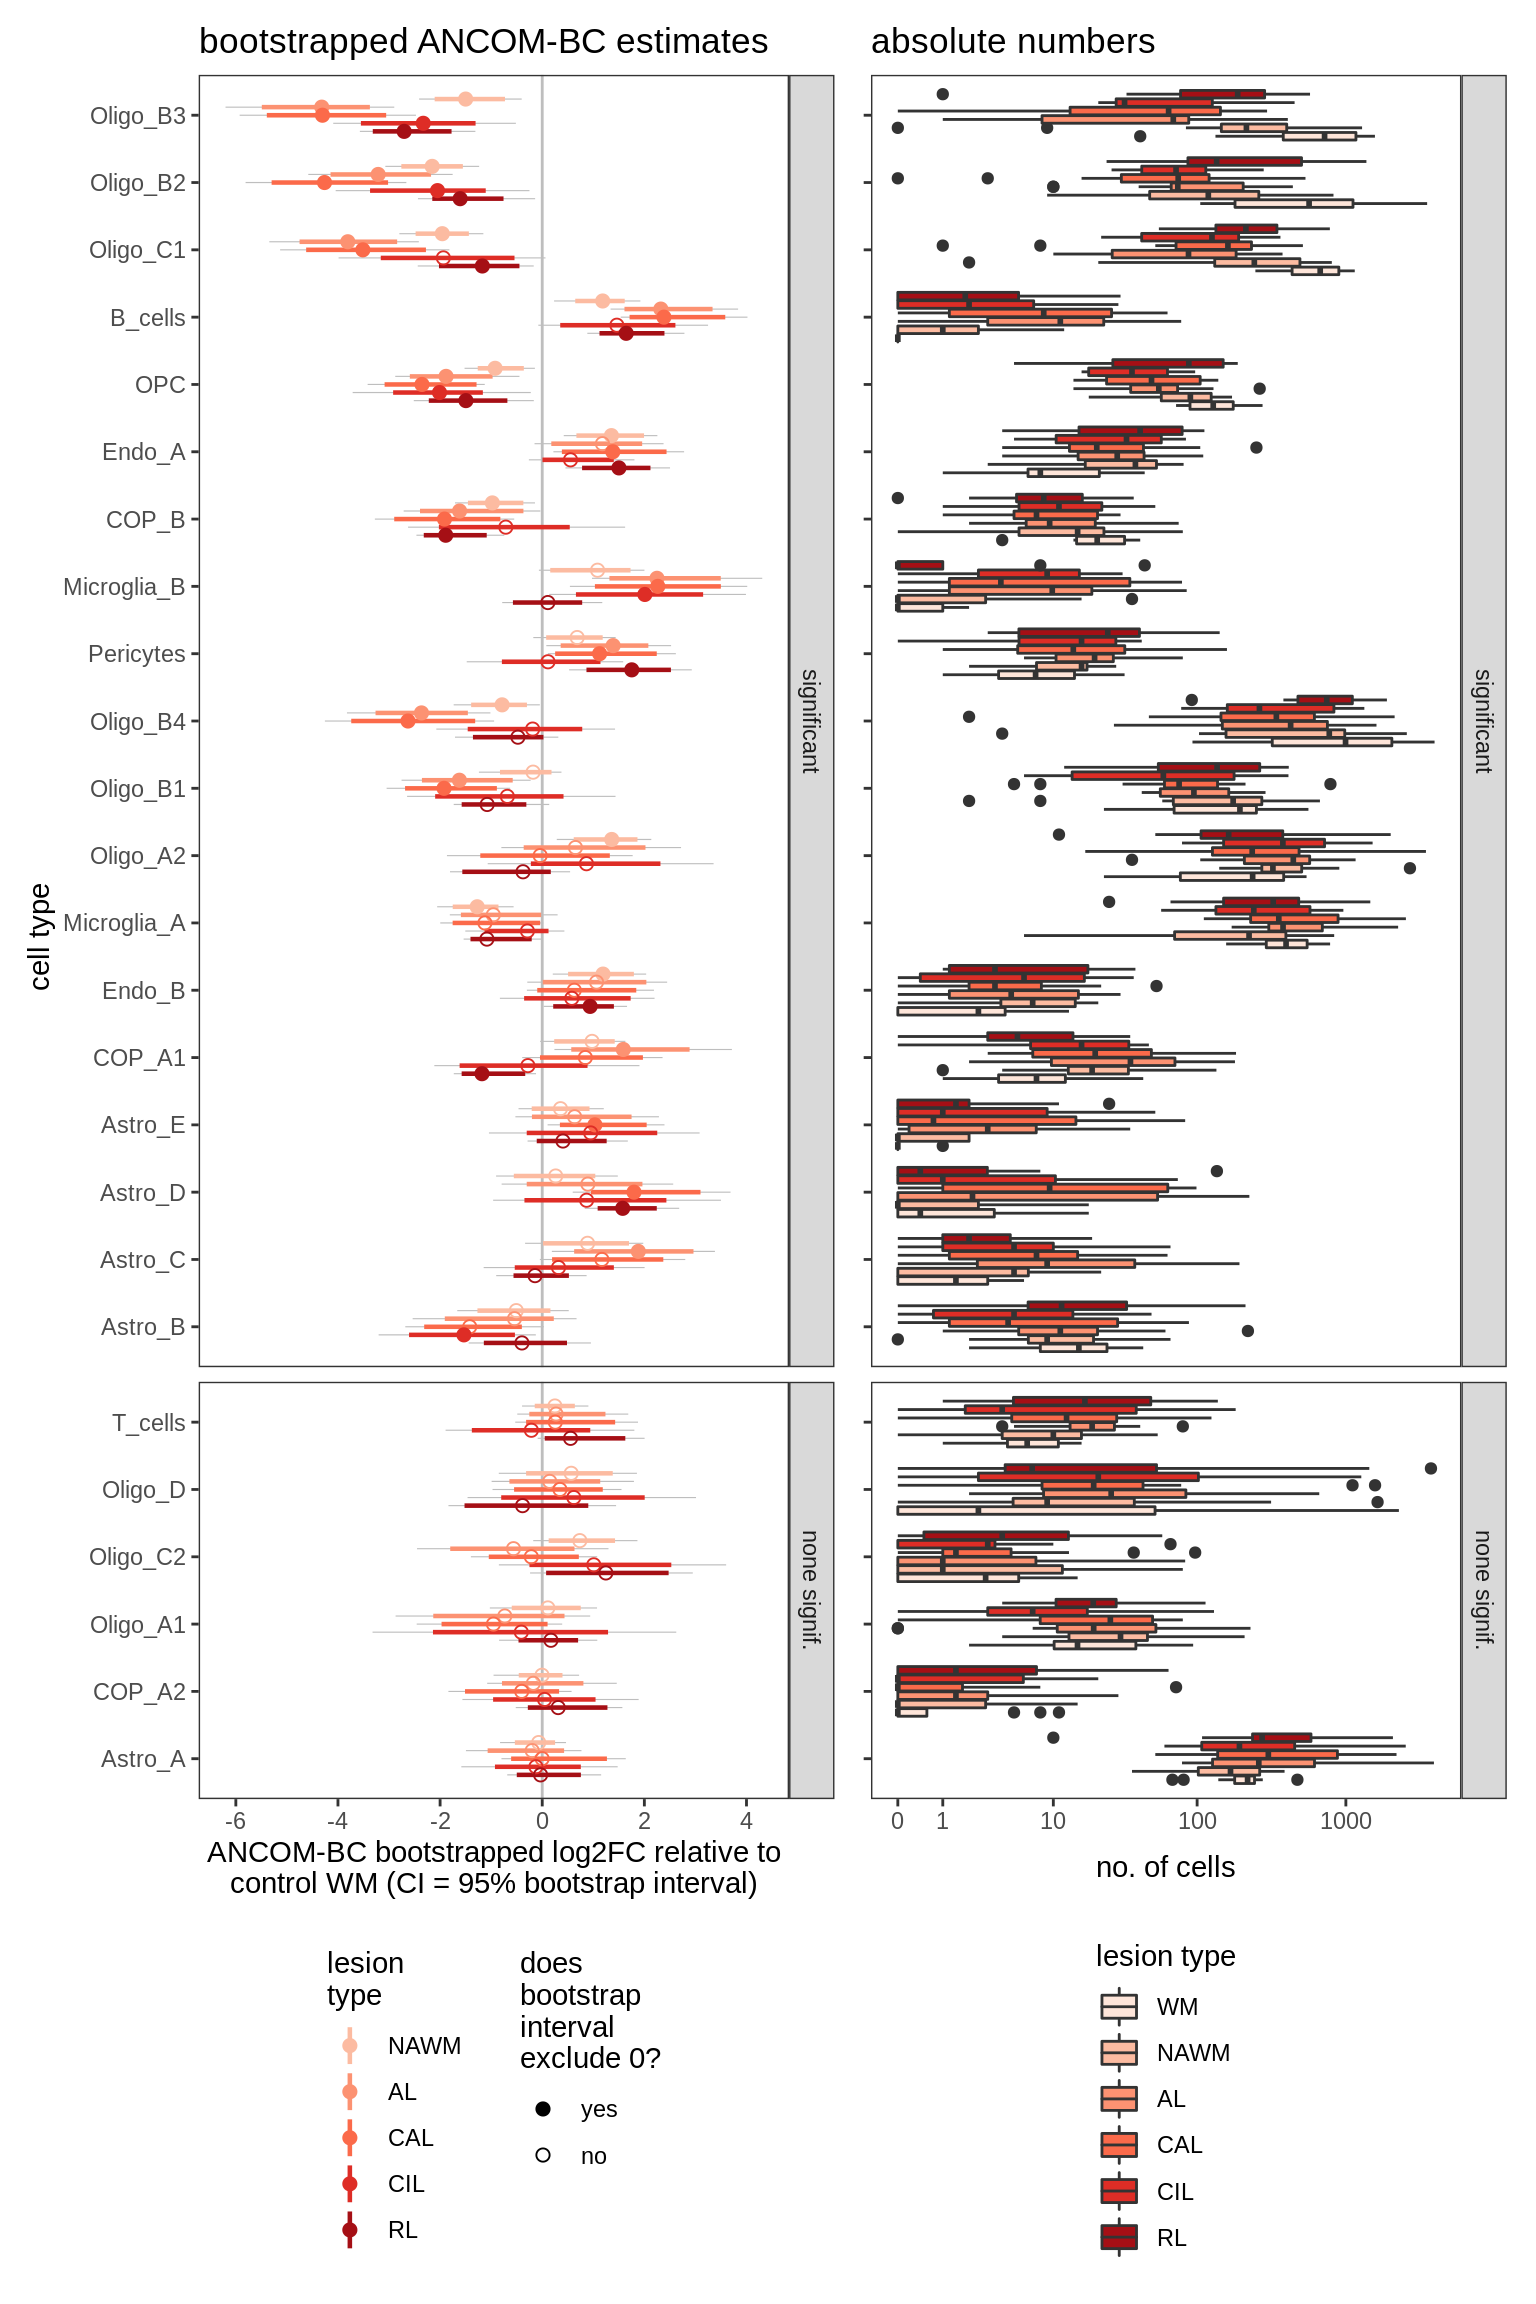
ED6d
Proportions of neuronal compartment per sample, split by layer-specificity of neurons. L1 and L2/L3 neurons account for relatively low proportions of NAGM samples, while L5 and L6 neurons account for high proportions of NAGM samples; vice versa for GML samples, while ctrl GM lies in the middle. This indicates that, on average, the samples are roughly ordered as follows: NAGM is deeper than ctrl GM, which is deeper than GML.
include_graphics("figure/ms09_ancombc_mixed.Rmd/plot_propns_layers-1.png", error = FALSE)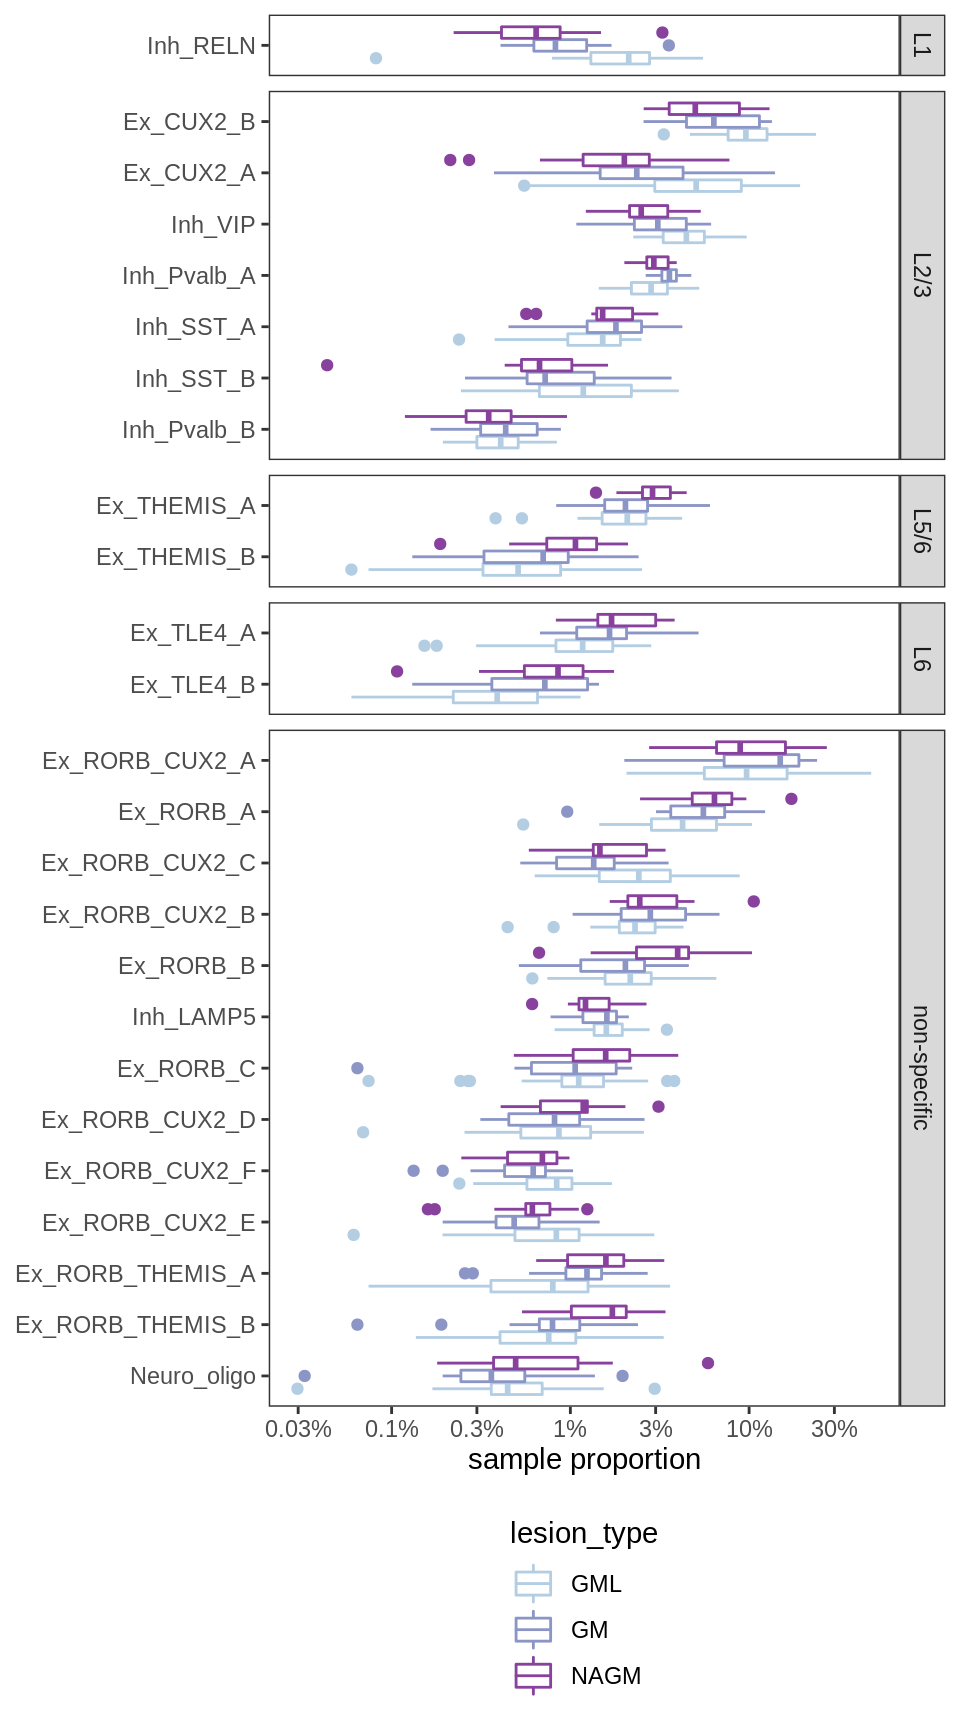
ED6e
Principal components of GM neuronal layer centred log ratios (CLRs; see Methods). y-axis shows absolute Spearman correlation between PC loadings and neuronal layer numbers (excluding neuronal clusters without an assigned layer number). x-axis shows the variance explained by each PC (on a log scale). Dashed lines show thresholds at 0.2 Spearman correlation, and 1% variance explained, giving up to 7 PCs that could be relevant to layers.
include_graphics("figure/ms09_ancombc_mixed.Rmd/plot_layer_var_exp-1.png", error = FALSE)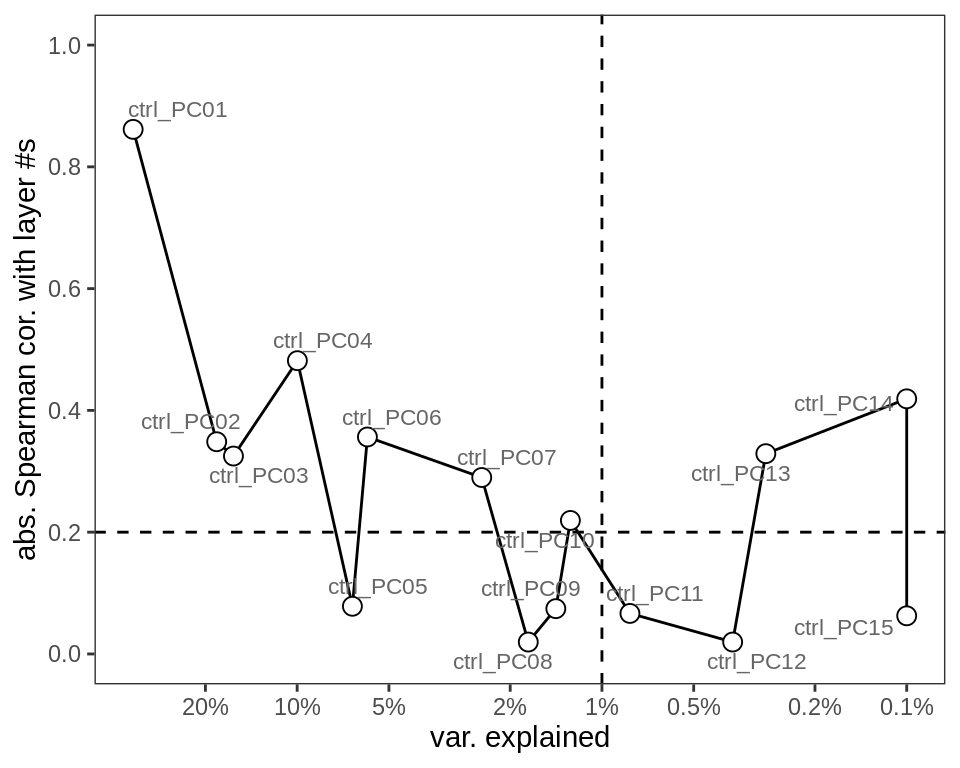
ED6f
Differential abundance of GM lesion samples against control WM, as calculated by bootstrapped ANCOM-BC. Left Dashed line at 0 corresponds to no difference between control and lesion. Model fitted is count ~ lesion_type + sex + age_scale + pmi_cat + layer_PC1 + layer_PC2 + layer_PC3 + layer_PC4. Point corresponds to median log2FC effect estimated by ANCOM-BC; coloured range is 80% bootstrapped confidence interval, grey range is 95% CI. Points are filled when the 95% CI excludes zero; otherwise empty. Cell type called as significant when at the 95% CI excludes 0 for at least one lesion. Right Boxplots of absolute numbers cell types in left plot. Boxplots (and outlier dots) show range of total numbers of this cell type observed across samples.
include_graphics("figure/ms09_ancombc_mixed.Rmd/plot_bootstraps_lesions-6.png", error = FALSE)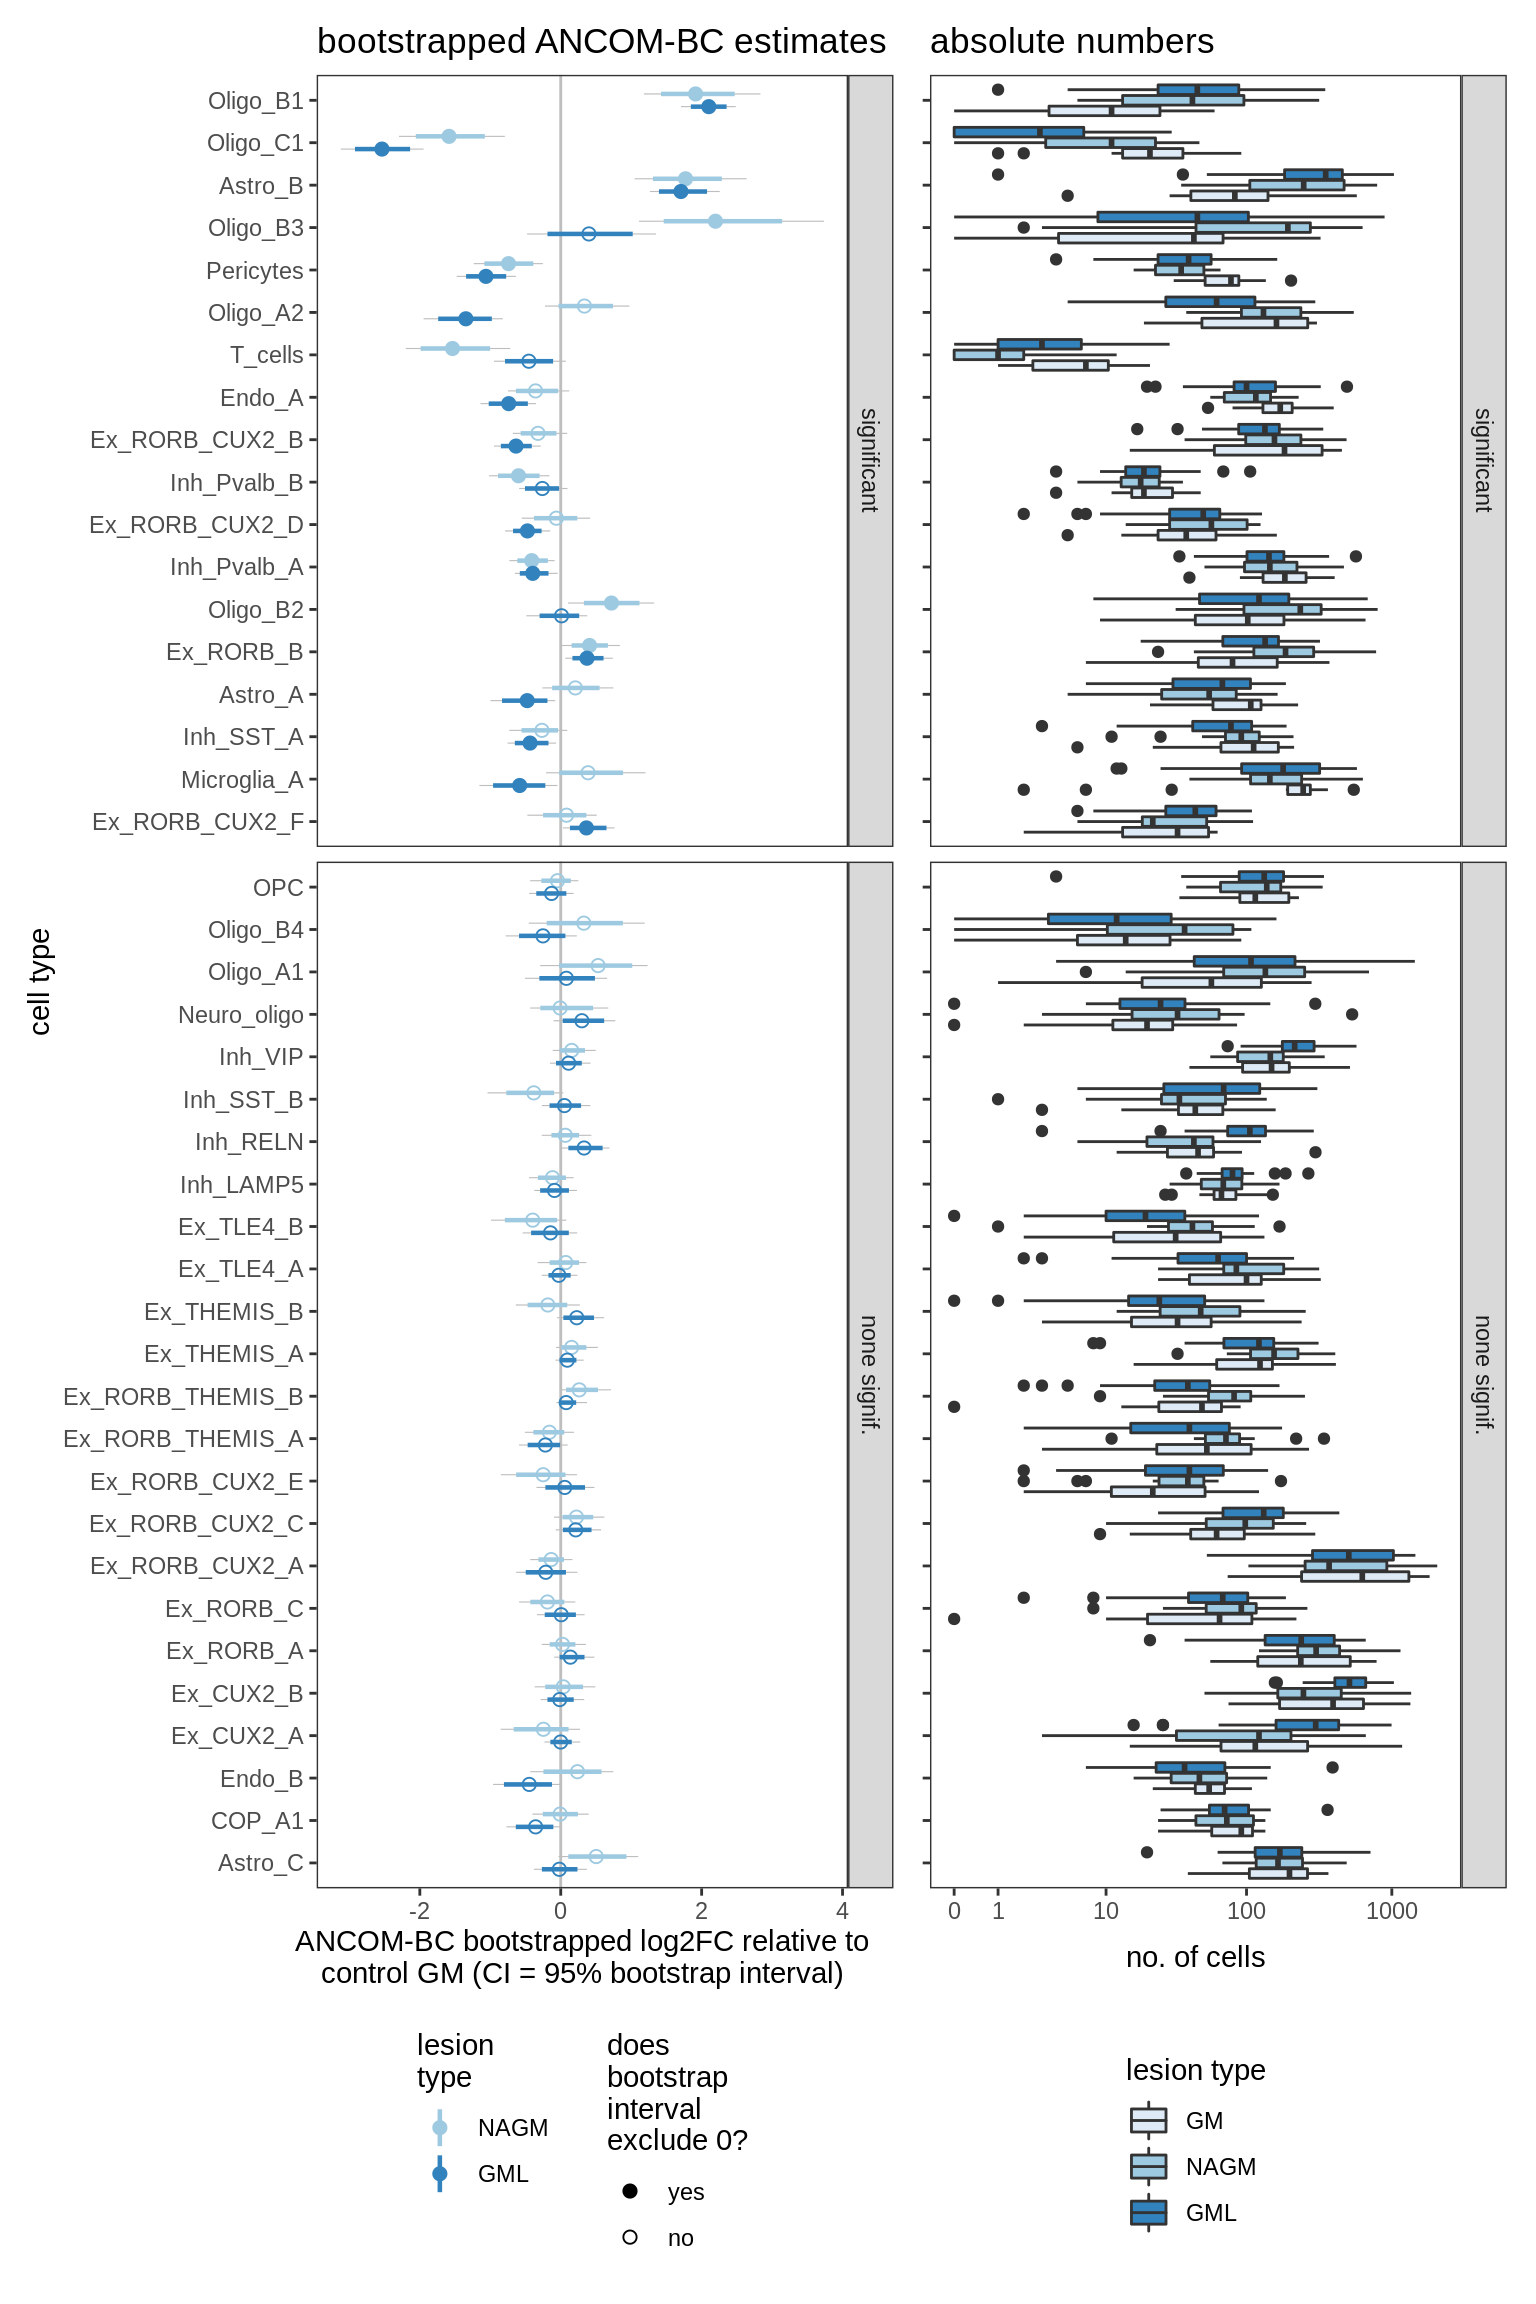
ED6g
Bootstrapped ANCOM-BC results including varying numbers of PCs as covariates. Number of PCs used varies from 0 to 7 (see S4B for rationale for 7). Grey lines show 95% bootstrapped confidence interval, coloured lines show 80% confidence interval; based on 20k bootstraps (large number taken to give reliable estimates of tails; see [ref: Hesterberg 2011]).
include_graphics("figure/ms09_ancombc_mixed.Rmd/plot_effect_of_pcs_lesions-1.png", error = FALSE)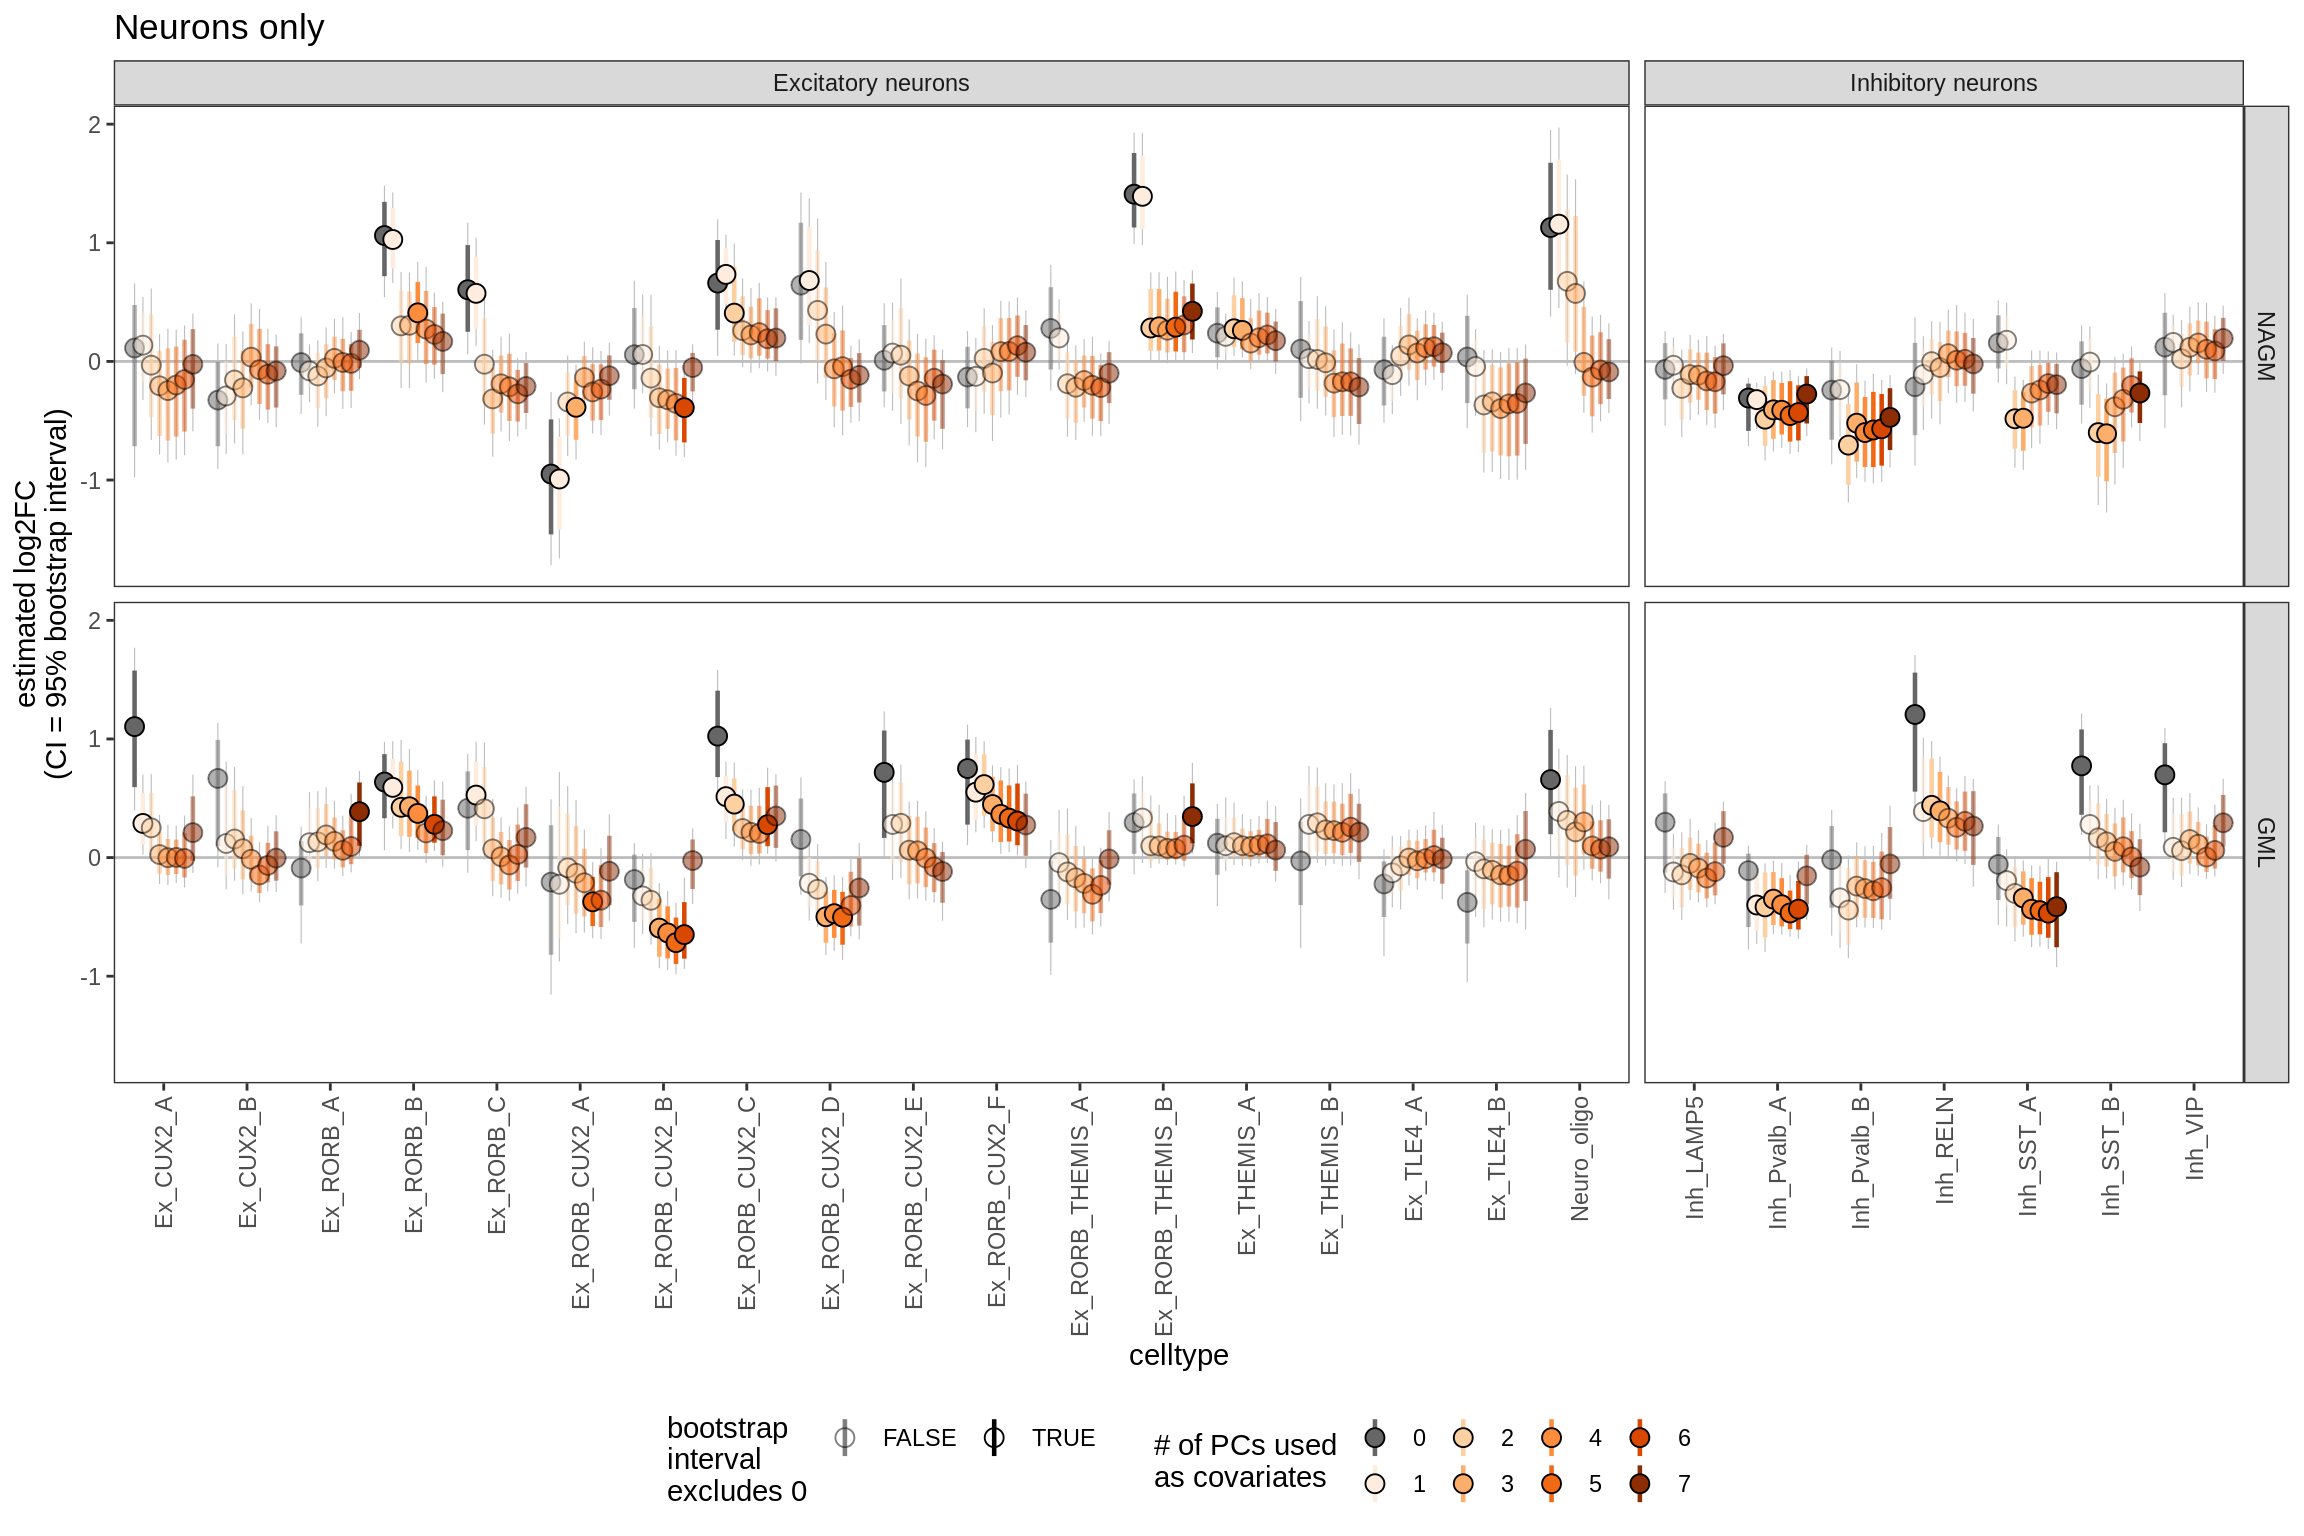
include_graphics("figure/ms09_ancombc_mixed.Rmd/plot_effect_of_pcs_lesions-2.png", error = FALSE)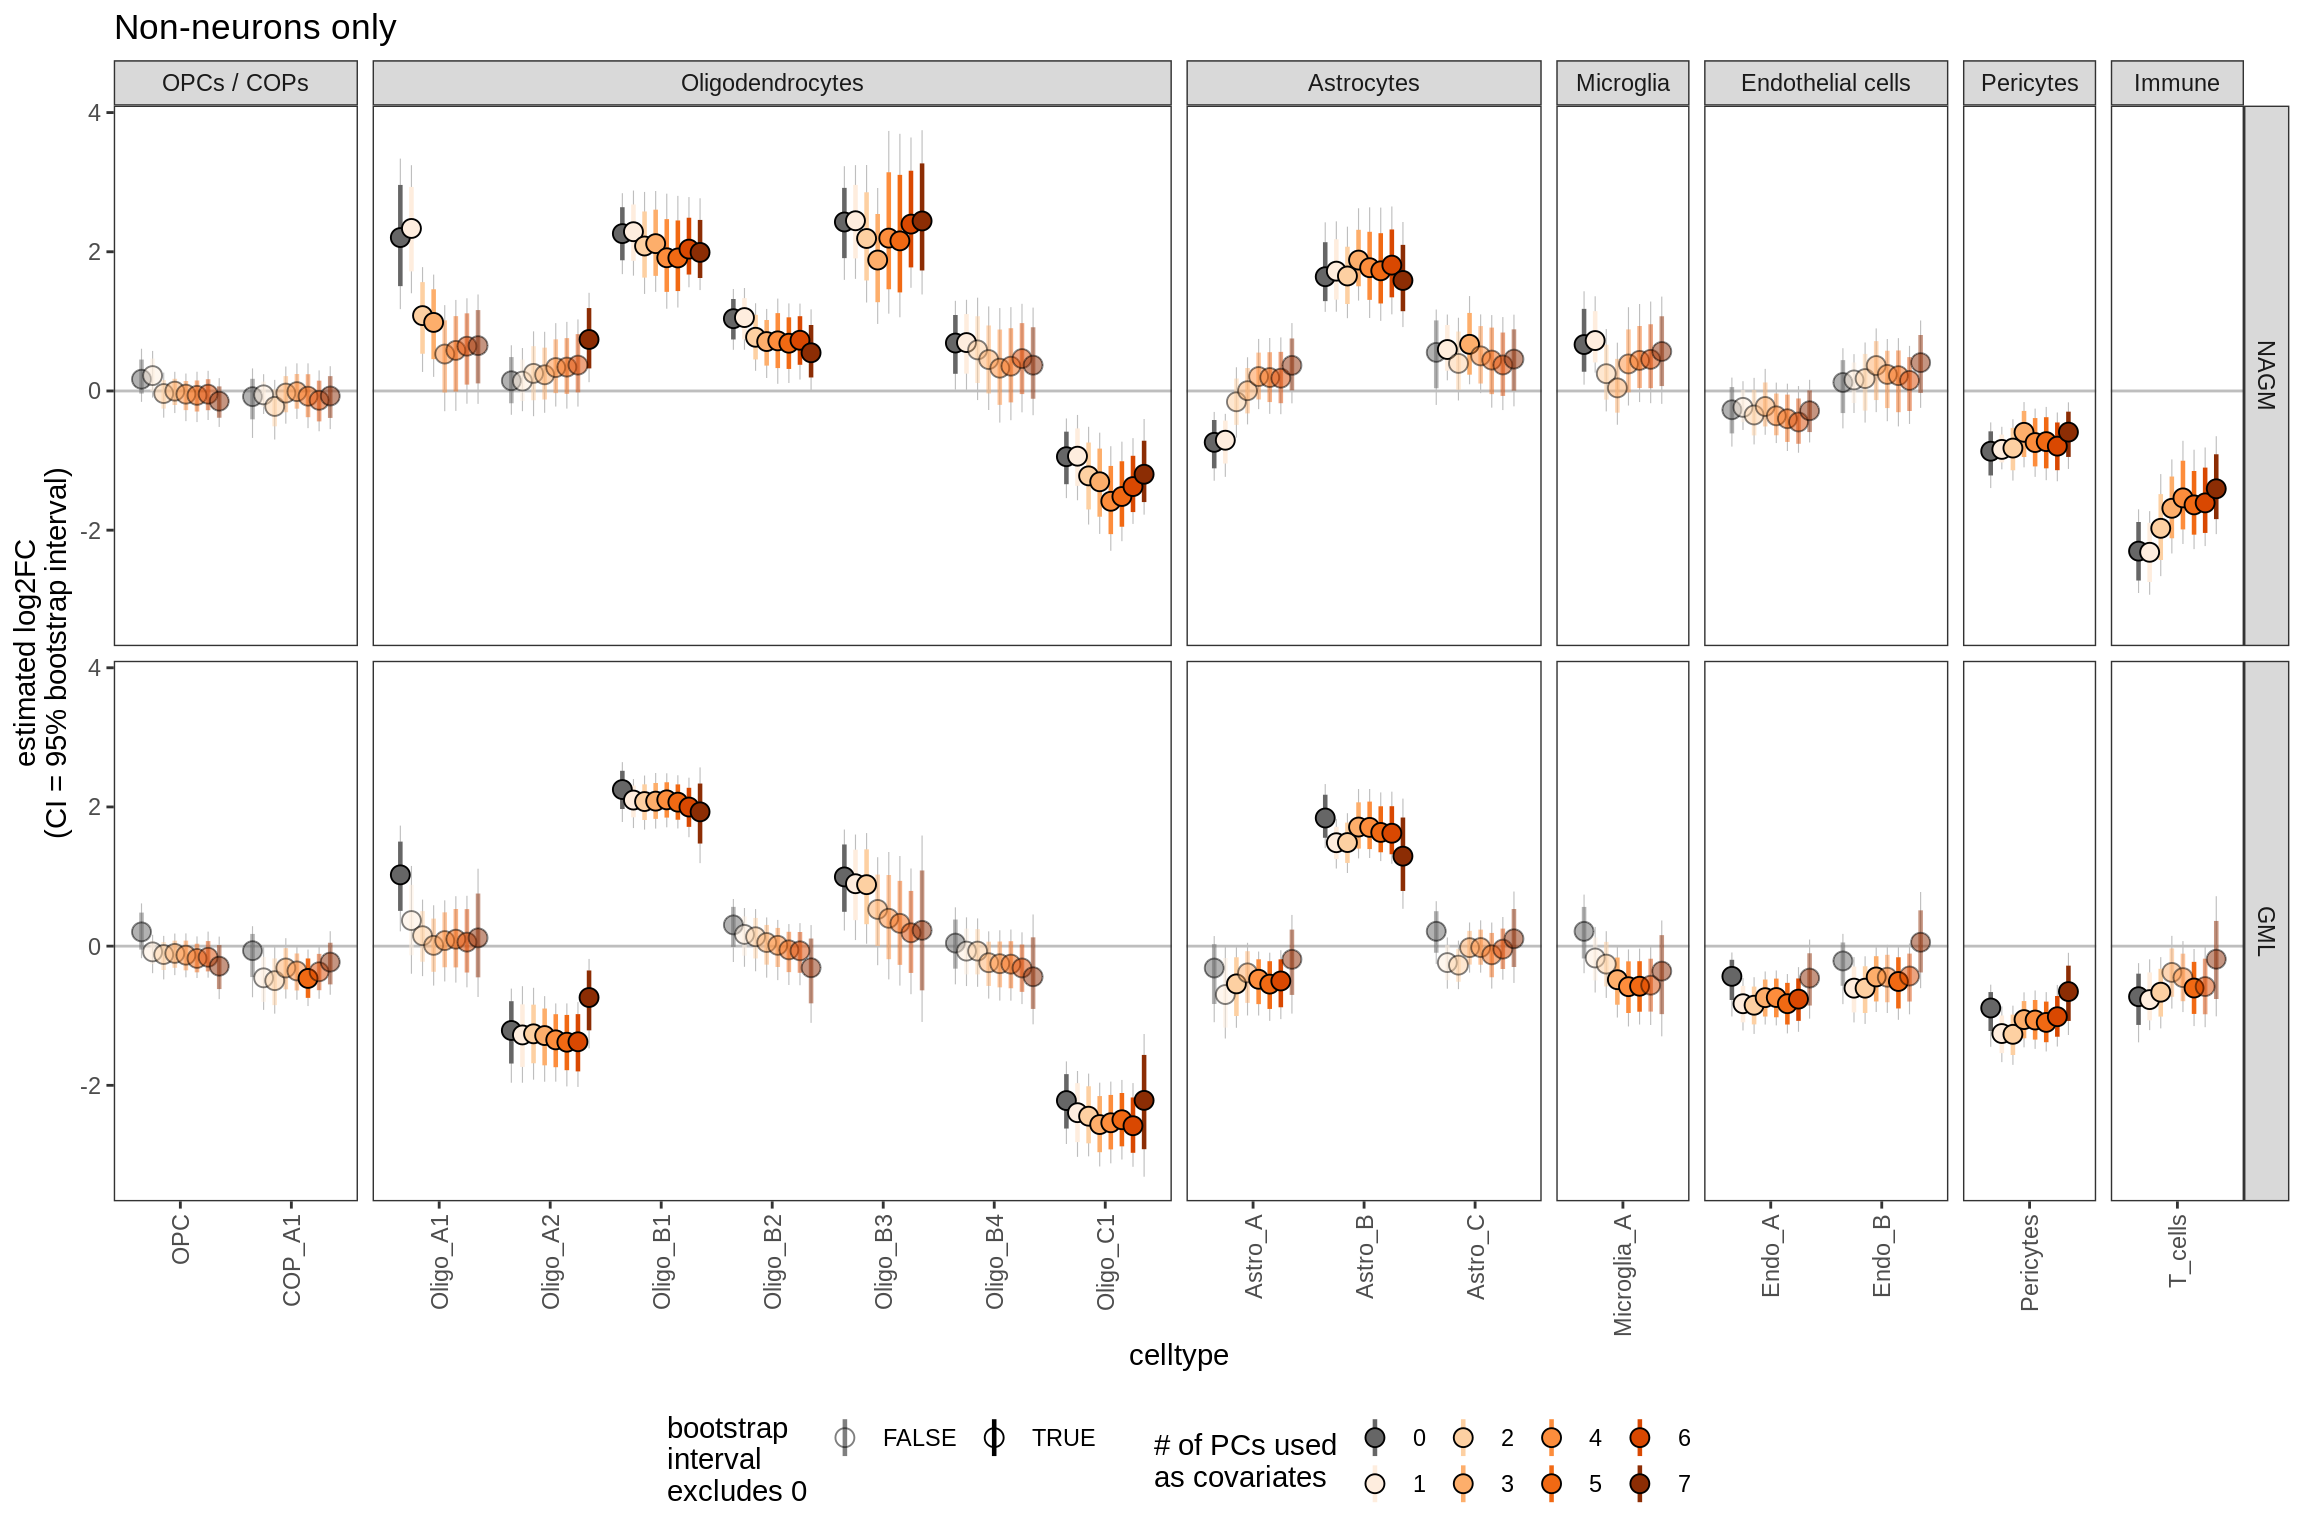
ED7
Heatmap of MOFA+ factors in WM (left), annotated with median QC metrics per sample (right). Left Rows are samples, annotated by metadata and oligo groupings; donor is colour for donor ID, with grey values used for donors contributing only one sample. Columns are MOFA+ factors, with signs changed to positively correlate with MS status. Right Columns are QC metrics: mito pct is the proportion of reads in the sample that are mitochondrial; pct unspliced is the proportion of reads in the sample that are unspliced as opposed to spliced mRNA; neuronal pct is the percentage of cells in the sample that are neurons. Colours in heatmap are the z-scores for each QC metric column, with colours chosen so that dark purple is ‘bad’ (e.g. low library size, or high mitochondrial read percentage).
include_graphics("figure/ms15_mofa_wm_edger_libs.Rmd/plot_factors_heatmap_qc-1.png", error = FALSE)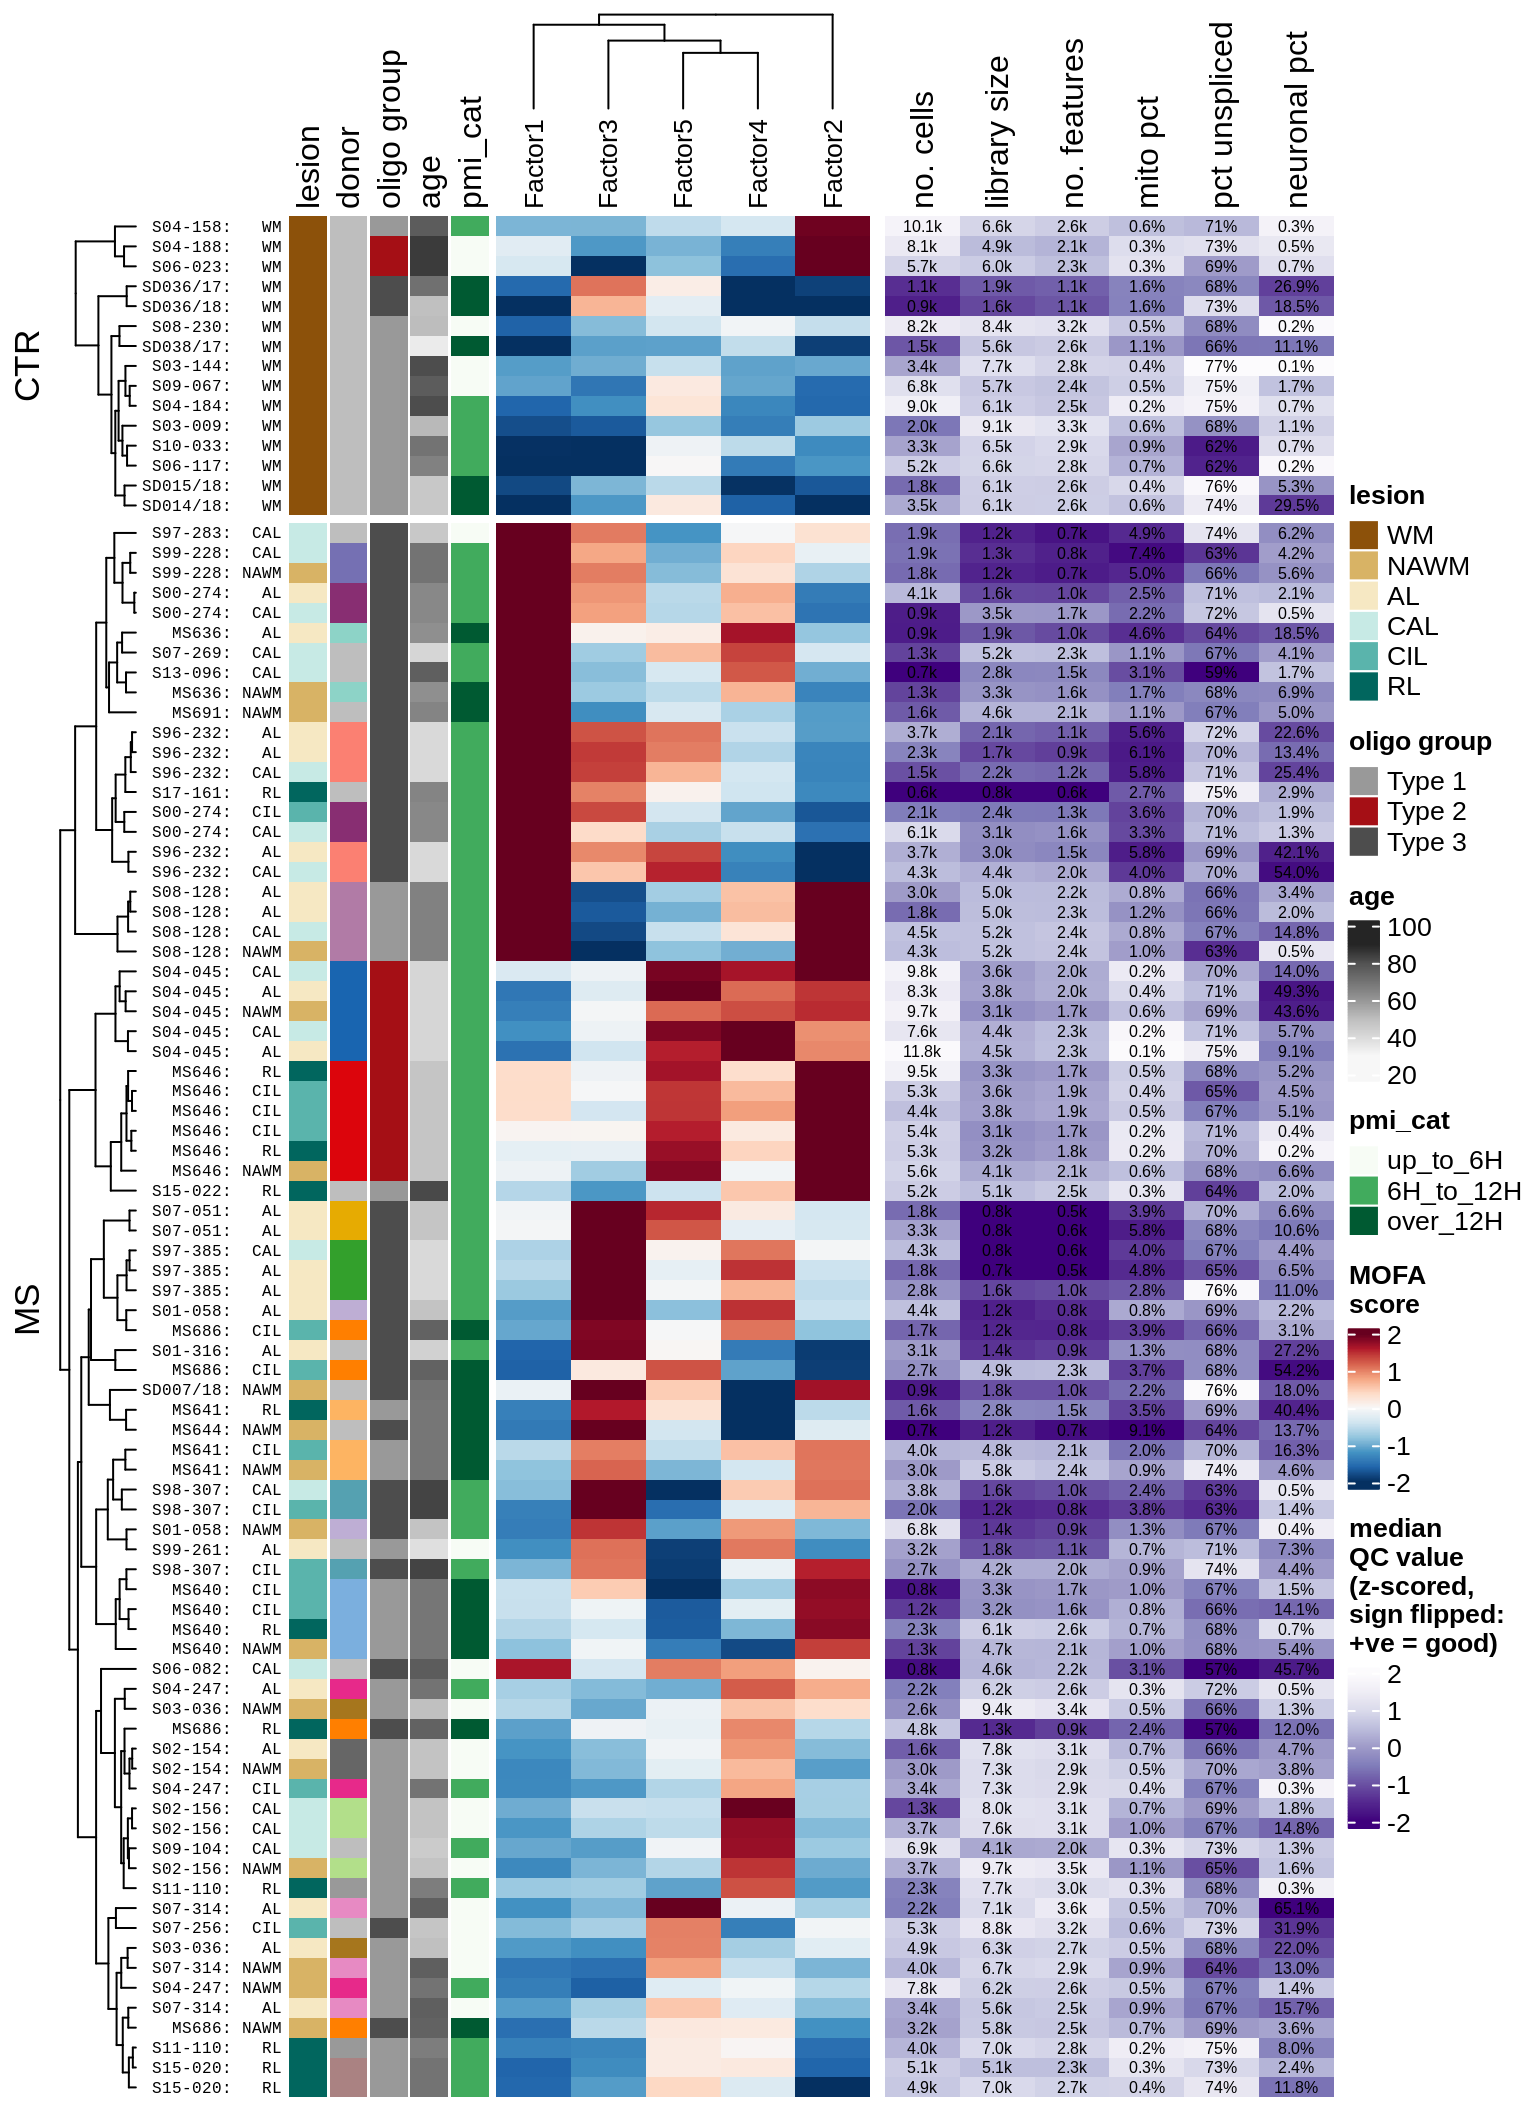
ED8a
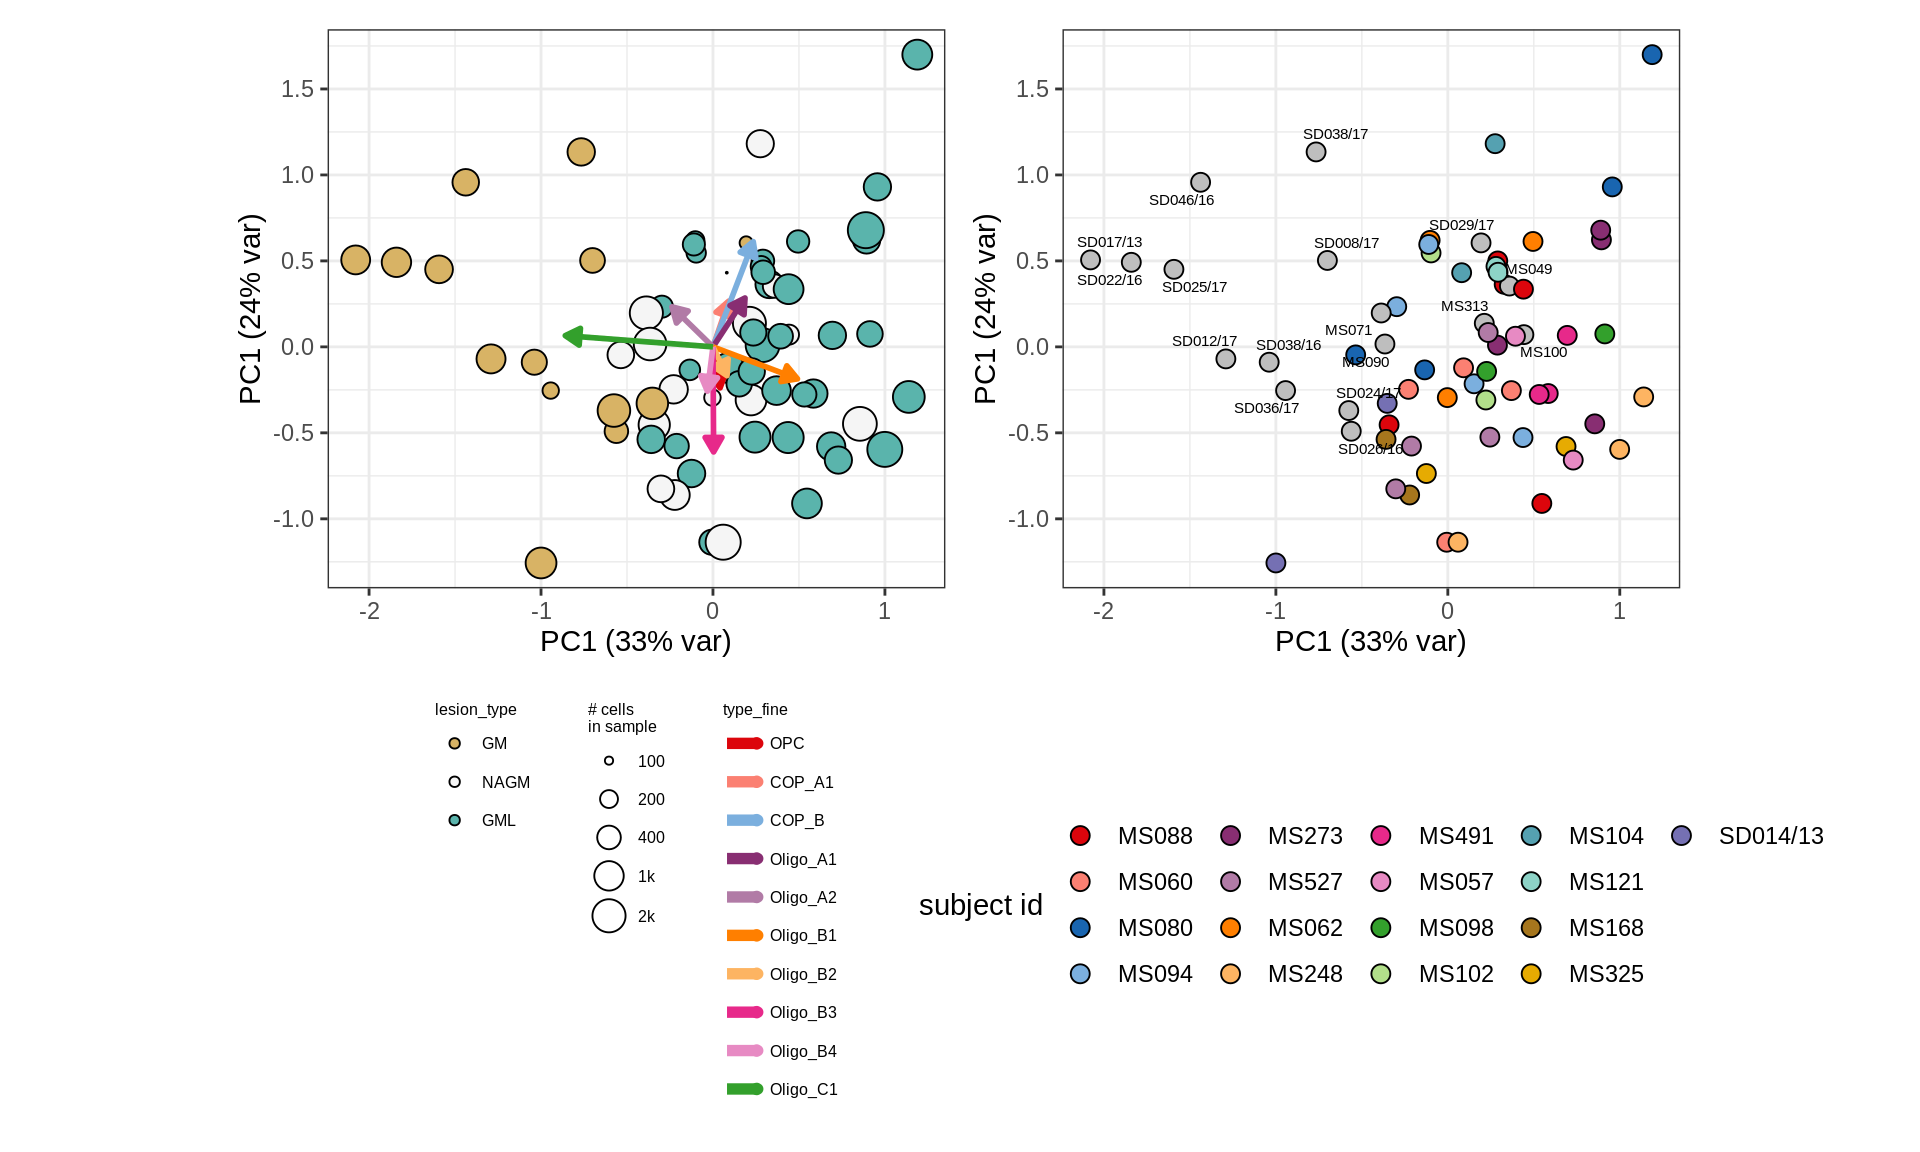
First two PCs of CLRs of oligodendroglia proportions. WM oligodendroglial compositional similarity between samples. Points are samples, represented by vector of proportions of 13 oligo + OPC subtypes, then transformed with centred log ratio (CLR), and PCA applied. To reduce noise, an empirical prior on sample proportions of 1k cells is used.
include_graphics("figure/ms09_ancombc_mixed.Rmd/plot_sample_splits_clrs_oligos-6.png", error = FALSE)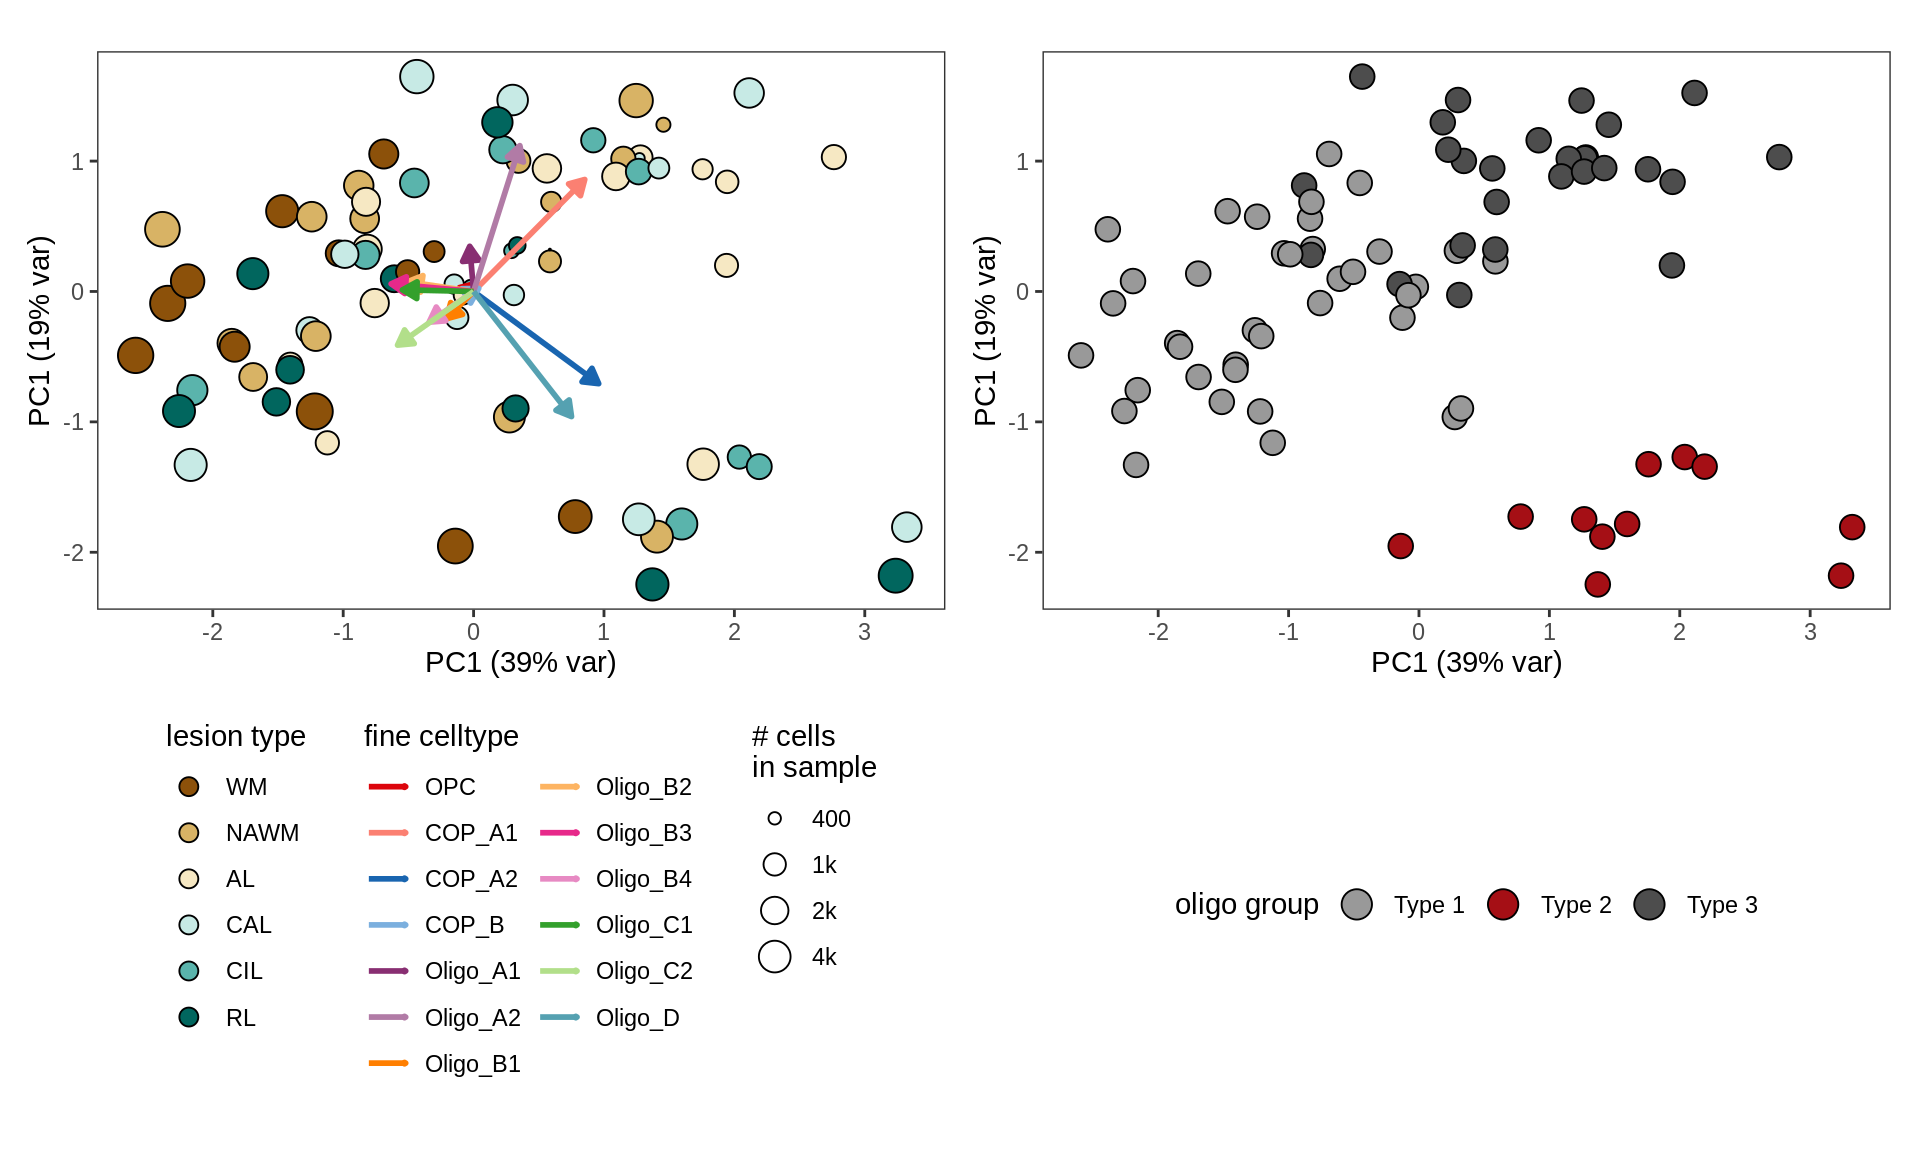
Session info
devtools::session_info()- Session info ---------------------------------------------------------------
setting value
version R version 4.1.2 (2021-11-01)
os Red Hat Enterprise Linux 8.2 (Ootpa)
system x86_64, linux-gnu
ui X11
language (EN)
collate en_US.UTF-8
ctype C
tz Europe/Amsterdam
date 2022-04-06
pandoc 2.5 @ /apps/rocs/pRED/2020.08/cascadelake/software/Pandoc/2.5/bin/ (via rmarkdown)
- Packages -------------------------------------------------------------------
package * version date (UTC) lib source
assertthat * 0.2.1 2019-03-21 [5] CRAN (R 4.1.2)
BiocManager * 1.30.16 2021-06-15 [3] CRAN (R 4.1.2)
BiocStyle * 2.22.0 2021-10-26 [3] Bioconductor
bslib 0.3.1 2021-10-06 [5] CRAN (R 4.1.2)
cachem 1.0.6 2021-08-19 [5] CRAN (R 4.1.2)
callr 3.7.0 2021-04-20 [5] CRAN (R 4.1.2)
cellranger 1.1.0 2016-07-27 [5] CRAN (R 4.1.2)
circlize * 0.4.13 2021-06-09 [3] CRAN (R 4.1.2)
cli 3.2.0 2022-02-14 [1] CRAN (R 4.1.2)
codetools 0.2-18 2020-11-04 [5] CRAN (R 4.1.2)
colorout * 1.2-2 2022-03-18 [1] Github (jalvesaq/colorout@79931fd)
colorspace 2.0-3 2022-02-21 [1] CRAN (R 4.1.2)
crayon 1.5.0 2022-02-14 [1] CRAN (R 4.1.2)
data.table * 1.14.2 2021-09-27 [5] CRAN (R 4.1.2)
DBI 1.1.1 2021-01-15 [5] CRAN (R 4.1.2)
desc 1.4.0 2021-09-28 [5] CRAN (R 4.1.2)
devtools 2.4.3 2021-11-30 [5] CRAN (R 4.1.2)
digest 0.6.29 2021-12-01 [5] CRAN (R 4.1.2)
dplyr 1.0.7 2021-06-18 [5] CRAN (R 4.1.2)
ellipsis 0.3.2 2021-04-29 [5] CRAN (R 4.1.2)
evaluate 0.15 2022-02-18 [1] CRAN (R 4.1.2)
fansi 1.0.3 2022-03-24 [1] CRAN (R 4.1.2)
fastmap 1.1.0 2021-01-25 [5] CRAN (R 4.1.2)
forcats * 0.5.1 2021-01-27 [5] CRAN (R 4.1.2)
fs 1.5.1 2021-11-30 [5] CRAN (R 4.1.2)
generics 0.1.1 2021-10-25 [5] CRAN (R 4.1.2)
ggplot2 * 3.3.5 2021-06-25 [5] CRAN (R 4.1.2)
git2r 0.29.0 2021-11-22 [5] CRAN (R 4.1.2)
GlobalOptions 0.1.2 2020-06-10 [3] CRAN (R 4.1.2)
glue 1.6.2 2022-02-24 [1] CRAN (R 4.1.2)
gridExtra 2.3 2017-09-09 [5] CRAN (R 4.1.2)
gtable 0.3.0 2019-03-25 [5] CRAN (R 4.1.2)
highr 0.9 2021-04-16 [5] CRAN (R 4.1.2)
htmltools 0.5.2 2021-08-25 [5] CRAN (R 4.1.2)
httpuv 1.6.3 2021-09-09 [5] CRAN (R 4.1.2)
jquerylib 0.1.4 2021-04-26 [5] CRAN (R 4.1.2)
jsonlite 1.8.0 2022-02-22 [1] CRAN (R 4.1.2)
knitr * 1.37 2021-12-16 [1] CRAN (R 4.1.2)
later 1.3.0 2021-08-18 [5] CRAN (R 4.1.2)
lifecycle 1.0.1 2021-09-24 [5] CRAN (R 4.1.2)
magrittr * 2.0.2 2022-01-26 [1] CRAN (R 4.1.2)
memoise 2.0.1 2021-11-26 [5] CRAN (R 4.1.2)
munsell 0.5.0 2018-06-12 [5] CRAN (R 4.1.2)
pillar 1.7.0 2022-02-01 [1] CRAN (R 4.1.2)
pkgbuild 1.2.1 2021-11-30 [5] CRAN (R 4.1.2)
pkgconfig 2.0.3 2019-09-22 [5] CRAN (R 4.1.2)
pkgload 1.2.4 2021-11-30 [5] CRAN (R 4.1.2)
prettyunits 1.1.1 2020-01-24 [5] CRAN (R 4.1.2)
processx 3.5.2 2021-04-30 [5] CRAN (R 4.1.2)
promises 1.2.0.1 2021-02-11 [5] CRAN (R 4.1.2)
ps 1.6.0 2021-02-28 [5] CRAN (R 4.1.2)
purrr 0.3.4 2020-04-17 [5] CRAN (R 4.1.2)
R6 2.5.1 2021-08-19 [5] CRAN (R 4.1.2)
RColorBrewer * 1.1-2 2014-12-07 [5] CRAN (R 4.1.2)
Rcpp 1.0.8.3 2022-03-17 [1] CRAN (R 4.1.2)
readxl * 1.3.1 2019-03-13 [5] CRAN (R 4.1.2)
remotes 2.4.2 2021-11-30 [5] CRAN (R 4.1.2)
rlang 1.0.2 2022-03-04 [1] CRAN (R 4.1.2)
rmarkdown 2.13 2022-03-10 [1] CRAN (R 4.1.2)
rprojroot 2.0.2 2020-11-15 [5] CRAN (R 4.1.2)
sass 0.4.0 2021-05-12 [5] CRAN (R 4.1.2)
scales * 1.1.1 2020-05-11 [5] CRAN (R 4.1.2)
sessioninfo 1.2.2 2021-12-06 [5] CRAN (R 4.1.2)
shape 1.4.6 2021-05-19 [3] CRAN (R 4.1.2)
stringi 1.7.6 2021-11-29 [5] CRAN (R 4.1.2)
stringr * 1.4.0 2019-02-10 [5] CRAN (R 4.1.2)
testthat 3.1.1 2021-12-03 [5] CRAN (R 4.1.2)
tibble 3.1.6 2021-11-07 [5] CRAN (R 4.1.2)
tidyselect 1.1.1 2021-04-30 [5] CRAN (R 4.1.2)
usethis 2.1.3 2021-10-27 [5] CRAN (R 4.1.2)
utf8 1.2.2 2021-07-24 [5] CRAN (R 4.1.2)
vctrs 0.3.8 2021-04-29 [5] CRAN (R 4.1.2)
viridis * 0.6.2 2021-10-13 [5] CRAN (R 4.1.2)
viridisLite * 0.4.0 2021-04-13 [5] CRAN (R 4.1.2)
whisker 0.4 2019-08-28 [5] CRAN (R 4.1.2)
withr 2.5.0 2022-03-03 [1] CRAN (R 4.1.2)
workflowr 1.7.0 2021-12-21 [1] CRAN (R 4.1.2)
xfun 0.30 2022-03-02 [1] CRAN (R 4.1.2)
yaml 2.3.5 2022-02-21 [1] CRAN (R 4.1.2)
[1] /gpfs/homefs/global/home/macnairw/R/x86_64-pc-linux-gnu-library/4.1.2-foss
[2] /apps/rocs/2020.08/cascadelake/software/R-Roche-bundle/2021.12-foss-2020a-R-4.1.2
[3] /apps/rocs/2020.08/cascadelake/software/R-bundle-Bioconductor/3.14-foss-2020a-R-4.1.2
[4] /apps/rocs/2020.08/cascadelake/software/ncdf4/1.18-foss-2020a-R-4.1.2
[5] /apps/rocs/2020.08/cascadelake/software/R/4.1.2-foss-2020a/lib64/R/library
------------------------------------------------------------------------------
sessionInfo()R version 4.1.2 (2021-11-01)
Platform: x86_64-pc-linux-gnu (64-bit)
Running under: Red Hat Enterprise Linux 8.2 (Ootpa)
Matrix products: default
BLAS/LAPACK: /apps/rocs/2020.08/cascadelake/software/OpenBLAS/0.3.9-GCC-9.3.0/lib/libopenblas_skylakexp-r0.3.9.so
locale:
[1] LC_CTYPE=C LC_NUMERIC=C
[3] LC_TIME=en_US.UTF-8 LC_COLLATE=en_US.UTF-8
[5] LC_MONETARY=en_US.UTF-8 LC_MESSAGES=en_US.UTF-8
[7] LC_PAPER=en_US.UTF-8 LC_NAME=C
[9] LC_ADDRESS=C LC_TELEPHONE=C
[11] LC_MEASUREMENT=en_US.UTF-8 LC_IDENTIFICATION=C
attached base packages:
[1] stats graphics grDevices utils datasets methods base
other attached packages:
[1] knitr_1.37 readxl_1.3.1 forcats_0.5.1
[4] ggplot2_3.3.5 scales_1.1.1 viridis_0.6.2
[7] viridisLite_0.4.0 assertthat_0.2.1 stringr_1.4.0
[10] data.table_1.14.2 magrittr_2.0.2 circlize_0.4.13
[13] RColorBrewer_1.1-2 BiocStyle_2.22.0 colorout_1.2-2
[16] BiocManager_1.30.16
loaded via a namespace (and not attached):
[1] Rcpp_1.0.8.3 prettyunits_1.1.1 ps_1.6.0
[4] rprojroot_2.0.2 digest_0.6.29 utf8_1.2.2
[7] R6_2.5.1 cellranger_1.1.0 evaluate_0.15
[10] highr_0.9 pillar_1.7.0 GlobalOptions_0.1.2
[13] rlang_1.0.2 callr_3.7.0 whisker_0.4
[16] jquerylib_0.1.4 rmarkdown_2.13 desc_1.4.0
[19] devtools_2.4.3 munsell_0.5.0 compiler_4.1.2
[22] httpuv_1.6.3 xfun_0.30 pkgconfig_2.0.3
[25] pkgbuild_1.2.1 shape_1.4.6 htmltools_0.5.2
[28] tidyselect_1.1.1 tibble_3.1.6 gridExtra_2.3
[31] workflowr_1.7.0 codetools_0.2-18 fansi_1.0.3
[34] crayon_1.5.0 dplyr_1.0.7 withr_2.5.0
[37] later_1.3.0 grid_4.1.2 jsonlite_1.8.0
[40] gtable_0.3.0 lifecycle_1.0.1 DBI_1.1.1
[43] git2r_0.29.0 cli_3.2.0 stringi_1.7.6
[46] cachem_1.0.6 remotes_2.4.2 fs_1.5.1
[49] promises_1.2.0.1 testthat_3.1.1 bslib_0.3.1
[52] ellipsis_0.3.2 generics_0.1.1 vctrs_0.3.8
[55] tools_4.1.2 glue_1.6.2 purrr_0.3.4
[58] pkgload_1.2.4 processx_3.5.2 fastmap_1.1.0
[61] yaml_2.3.5 colorspace_2.0-3 sessioninfo_1.2.2
[64] memoise_2.0.1 usethis_2.1.3 sass_0.4.0