140x140PDF reports

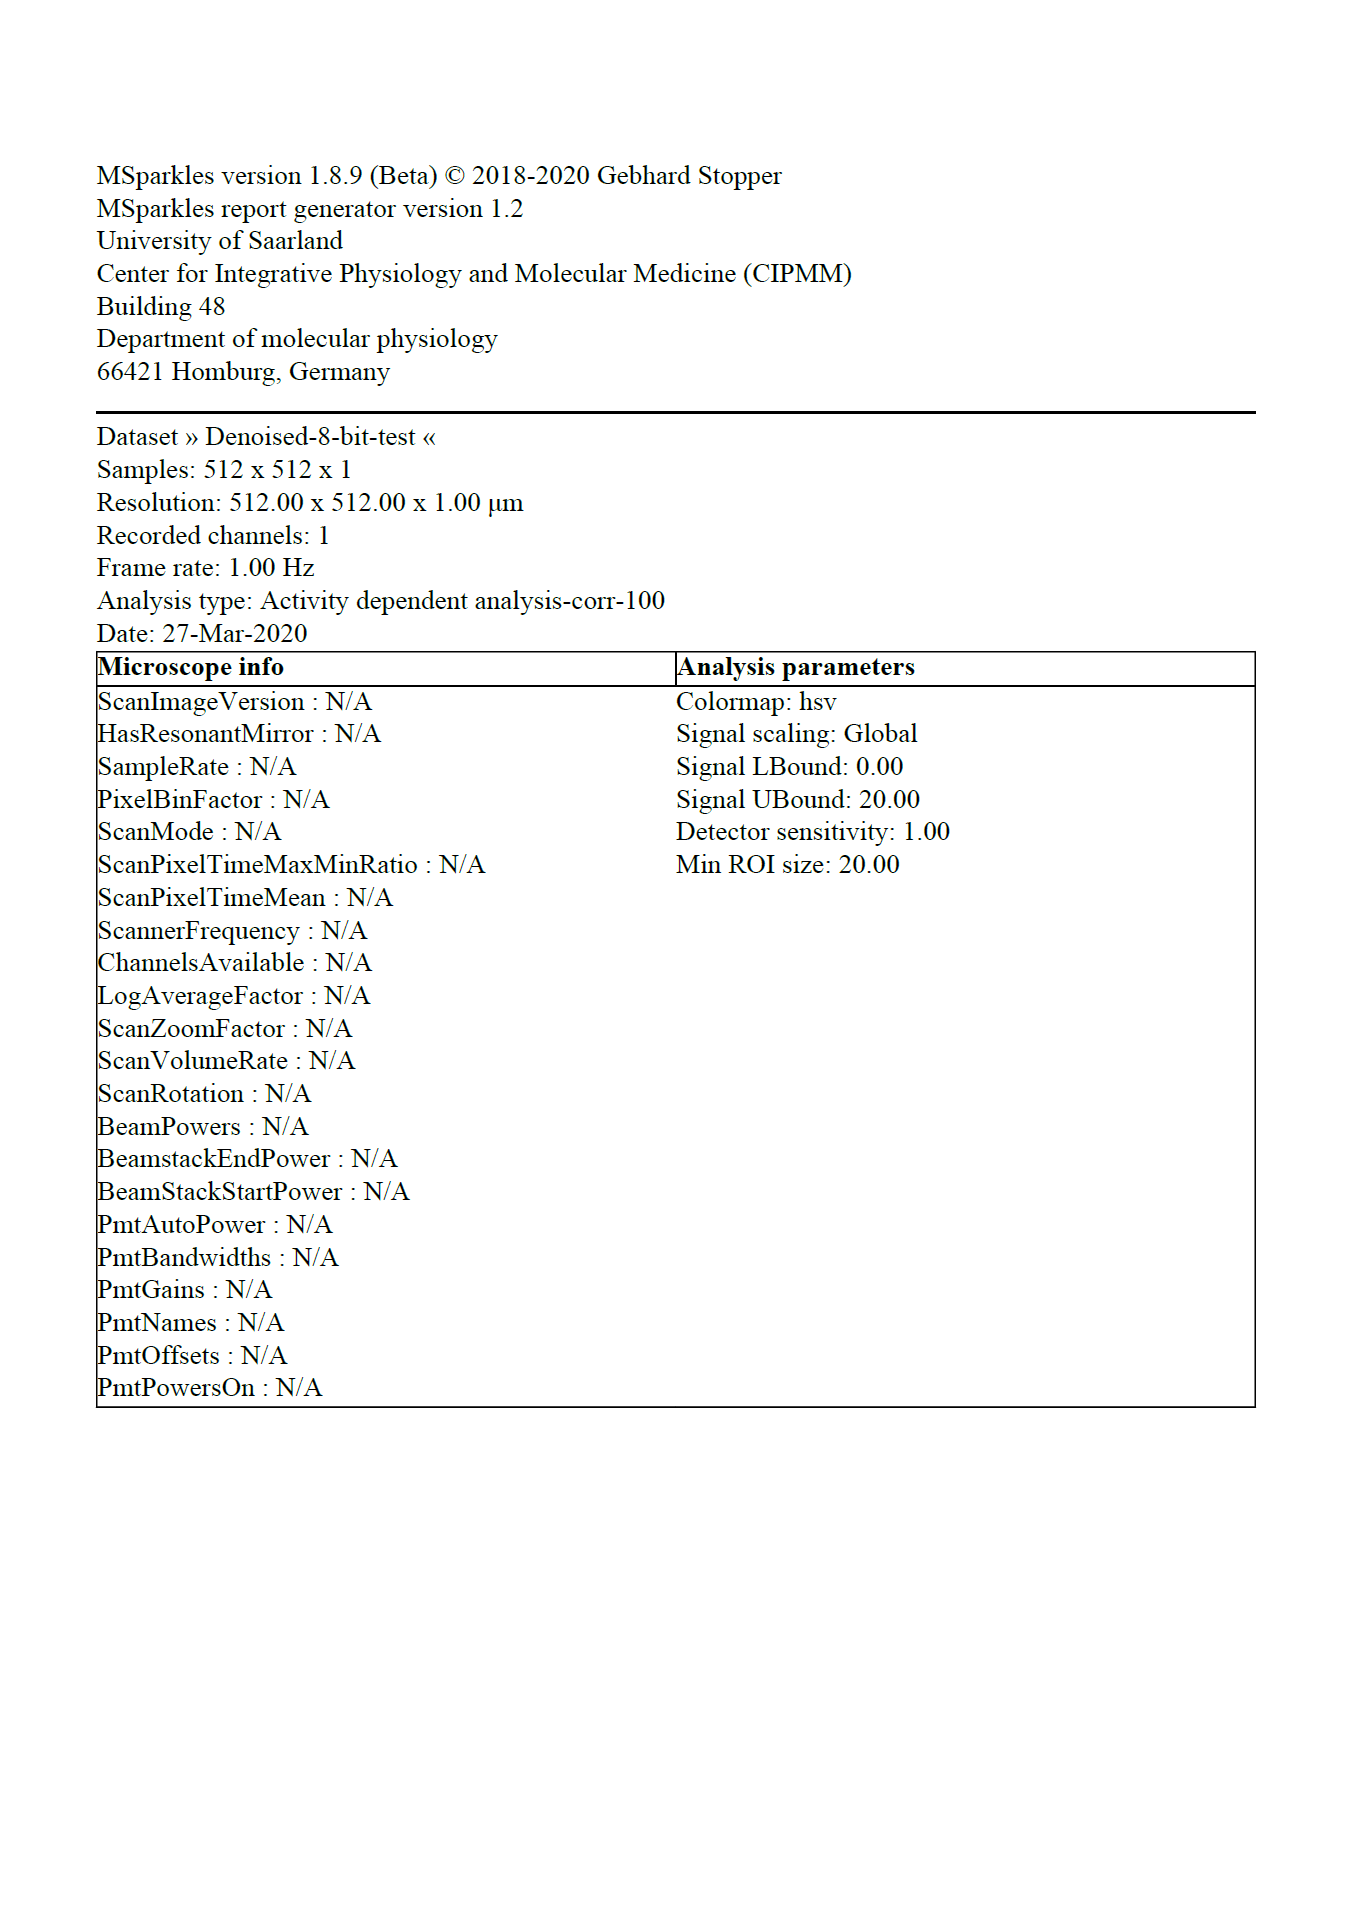
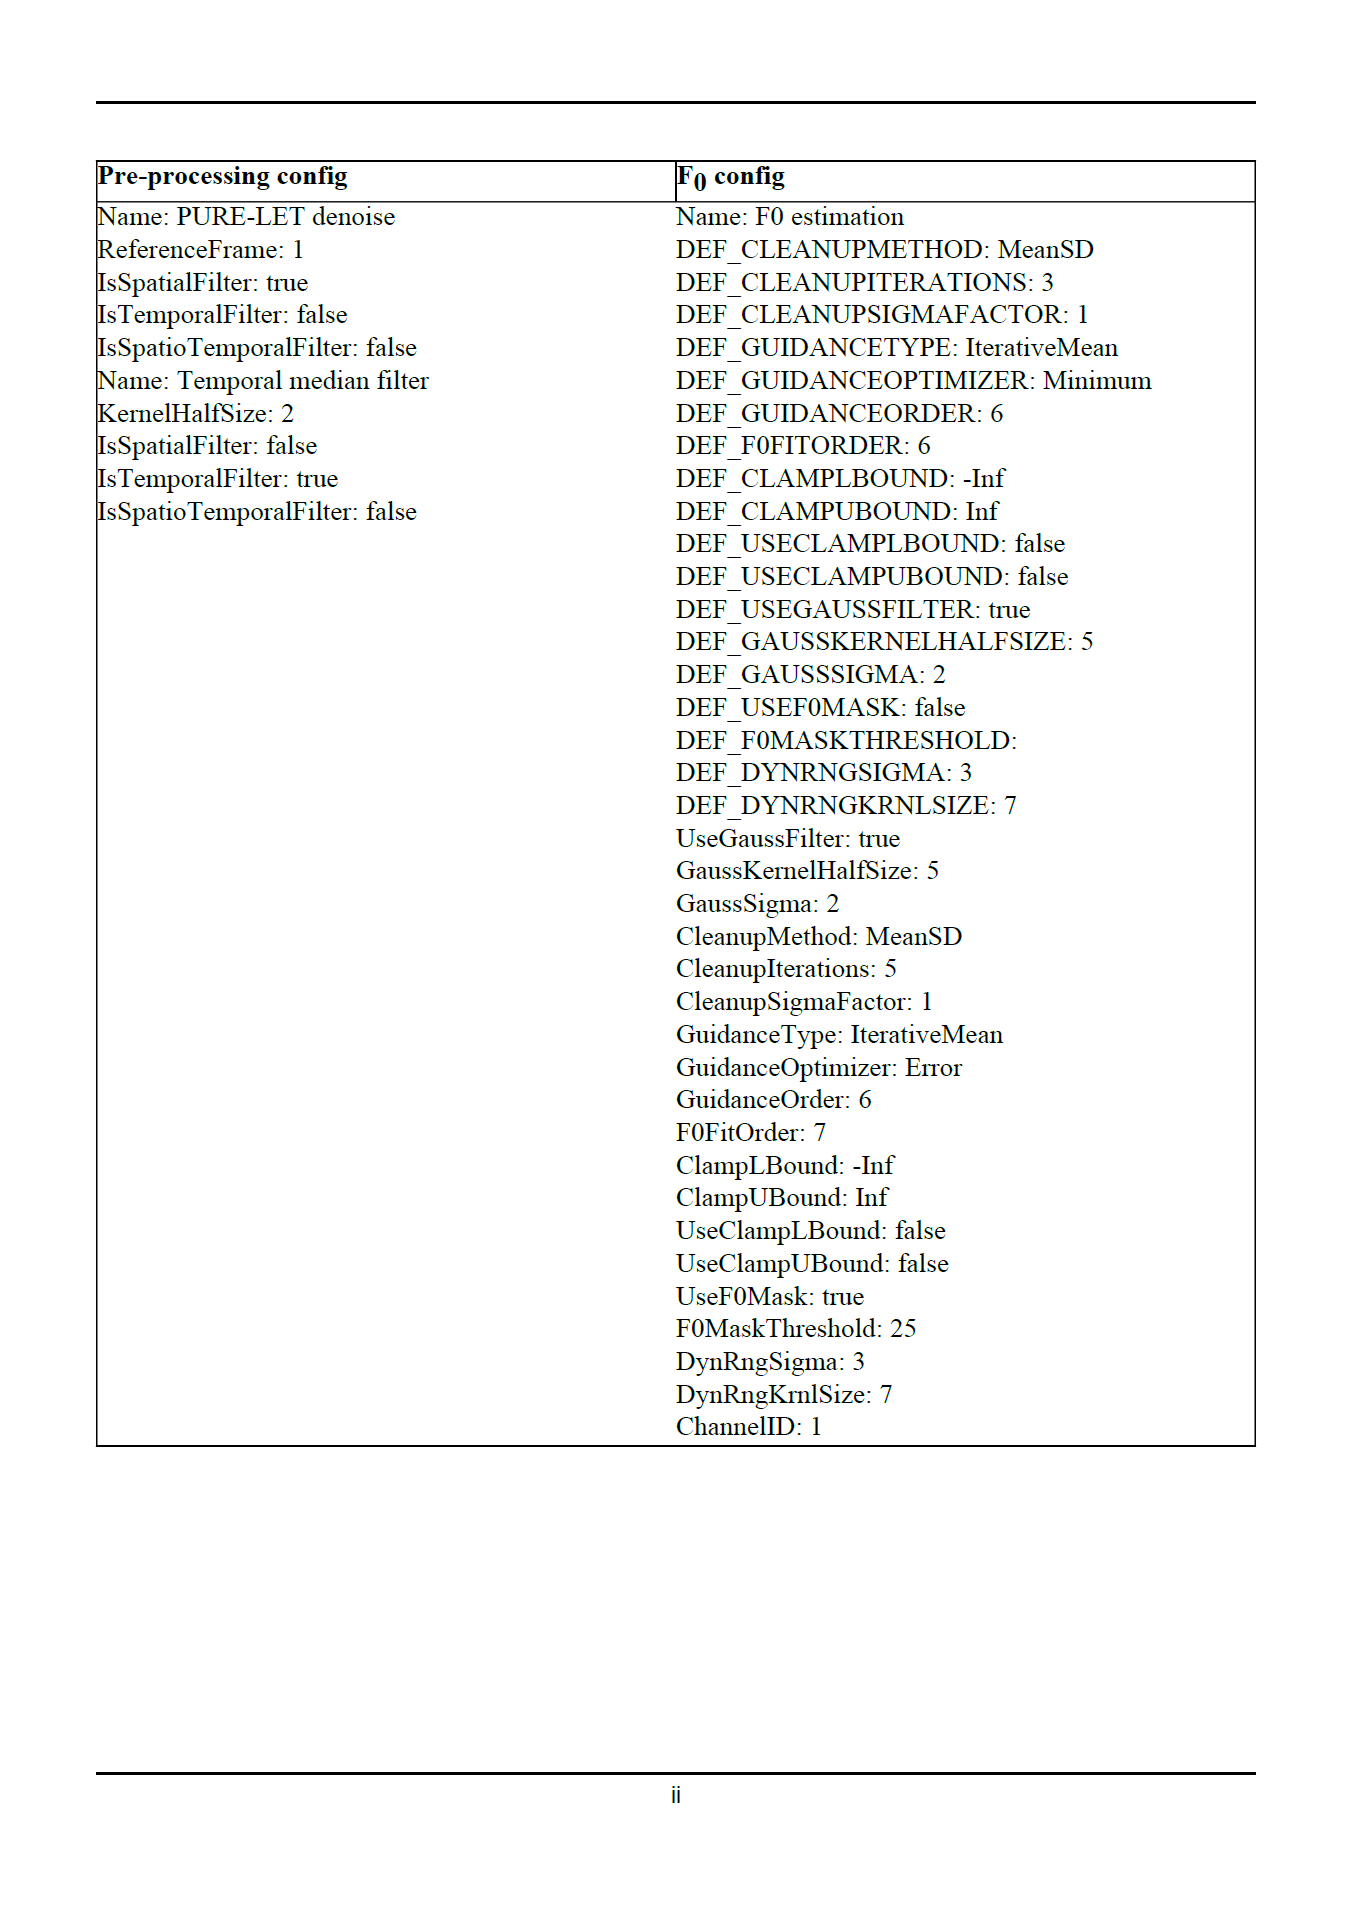
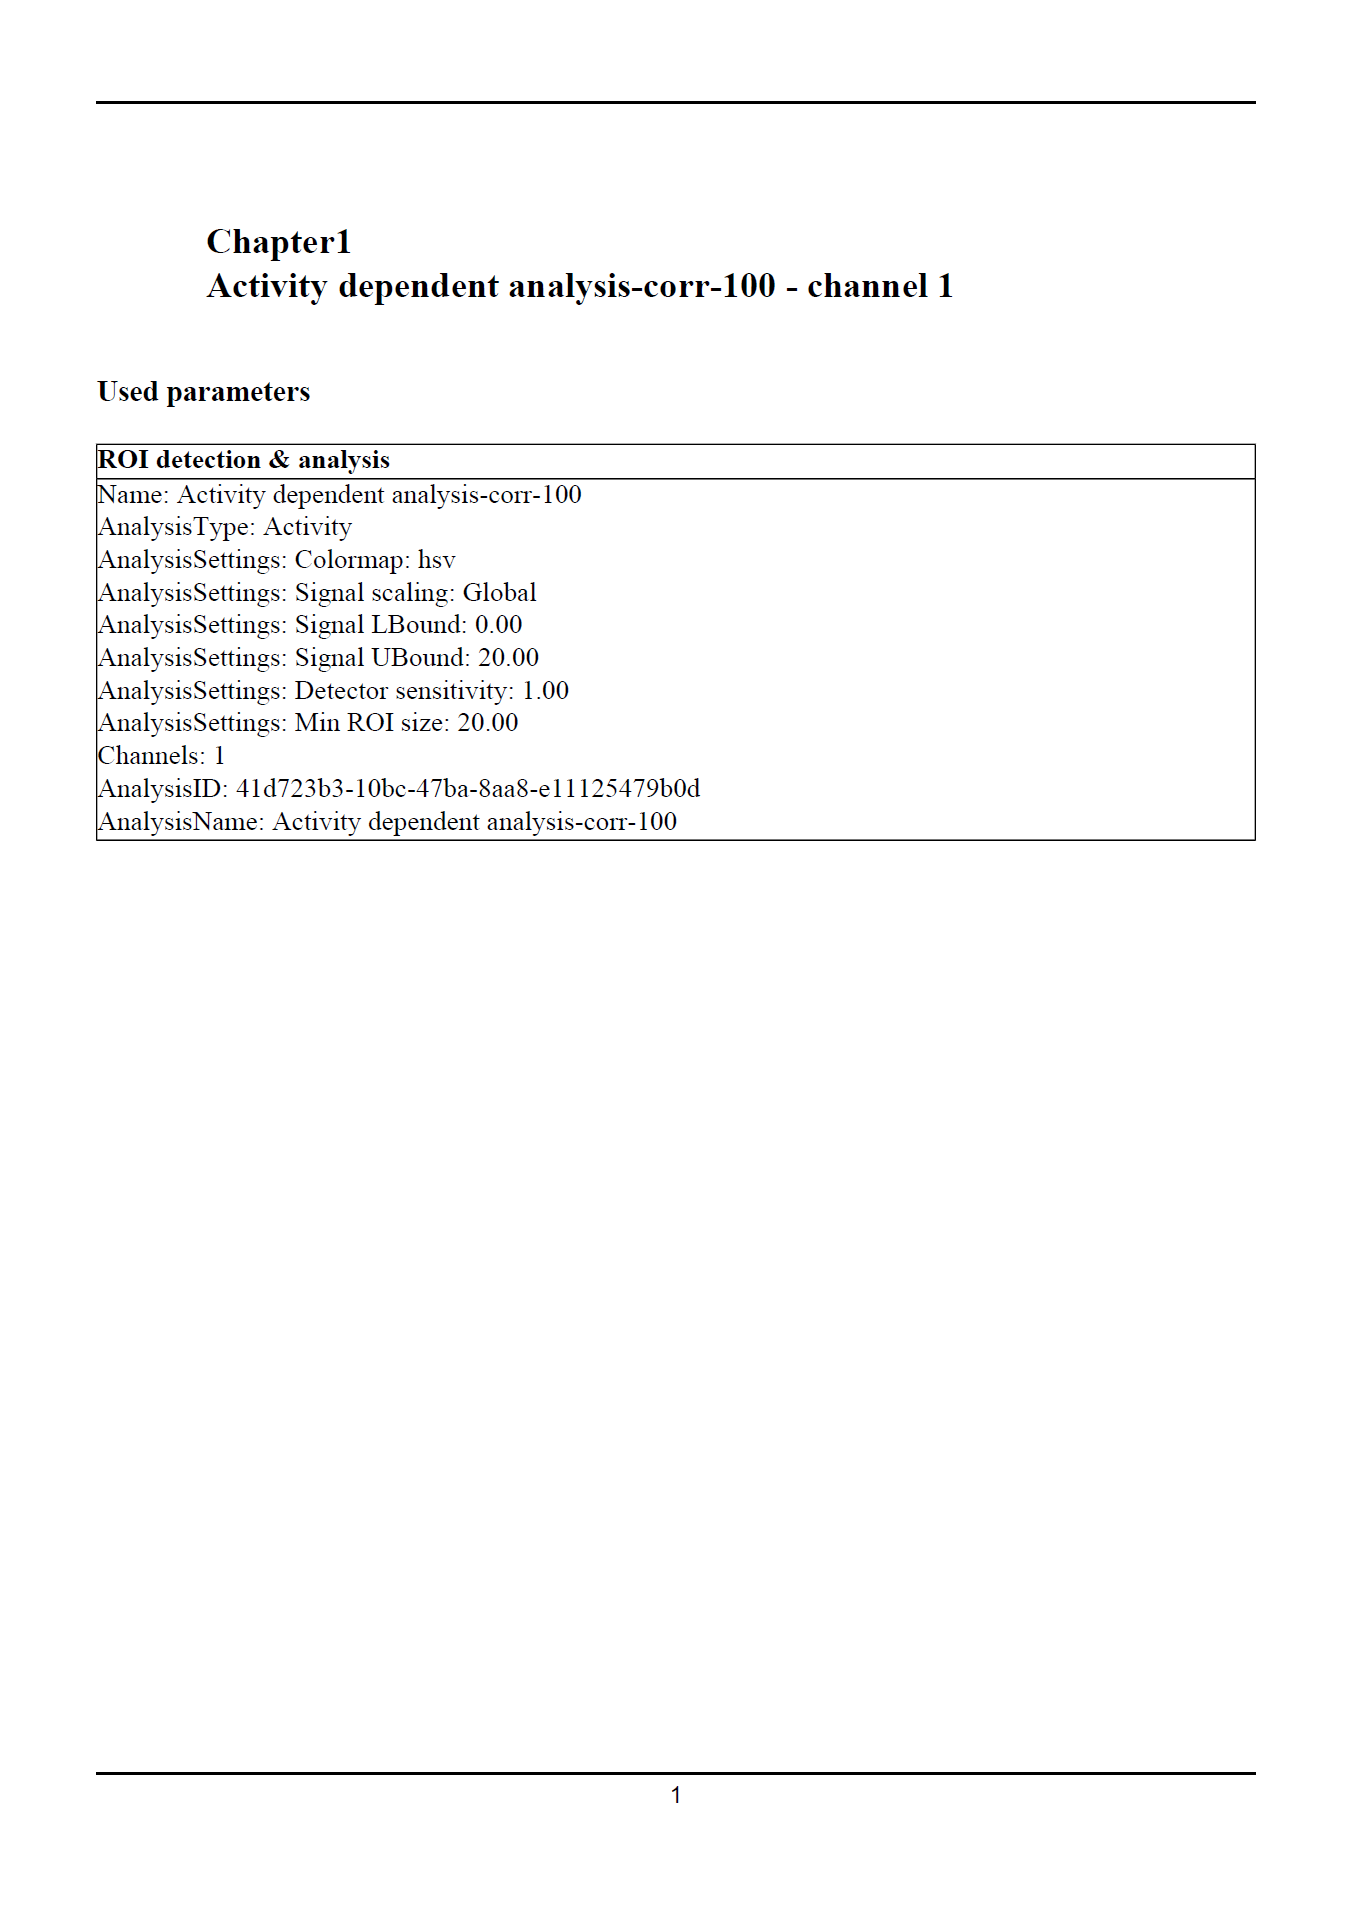
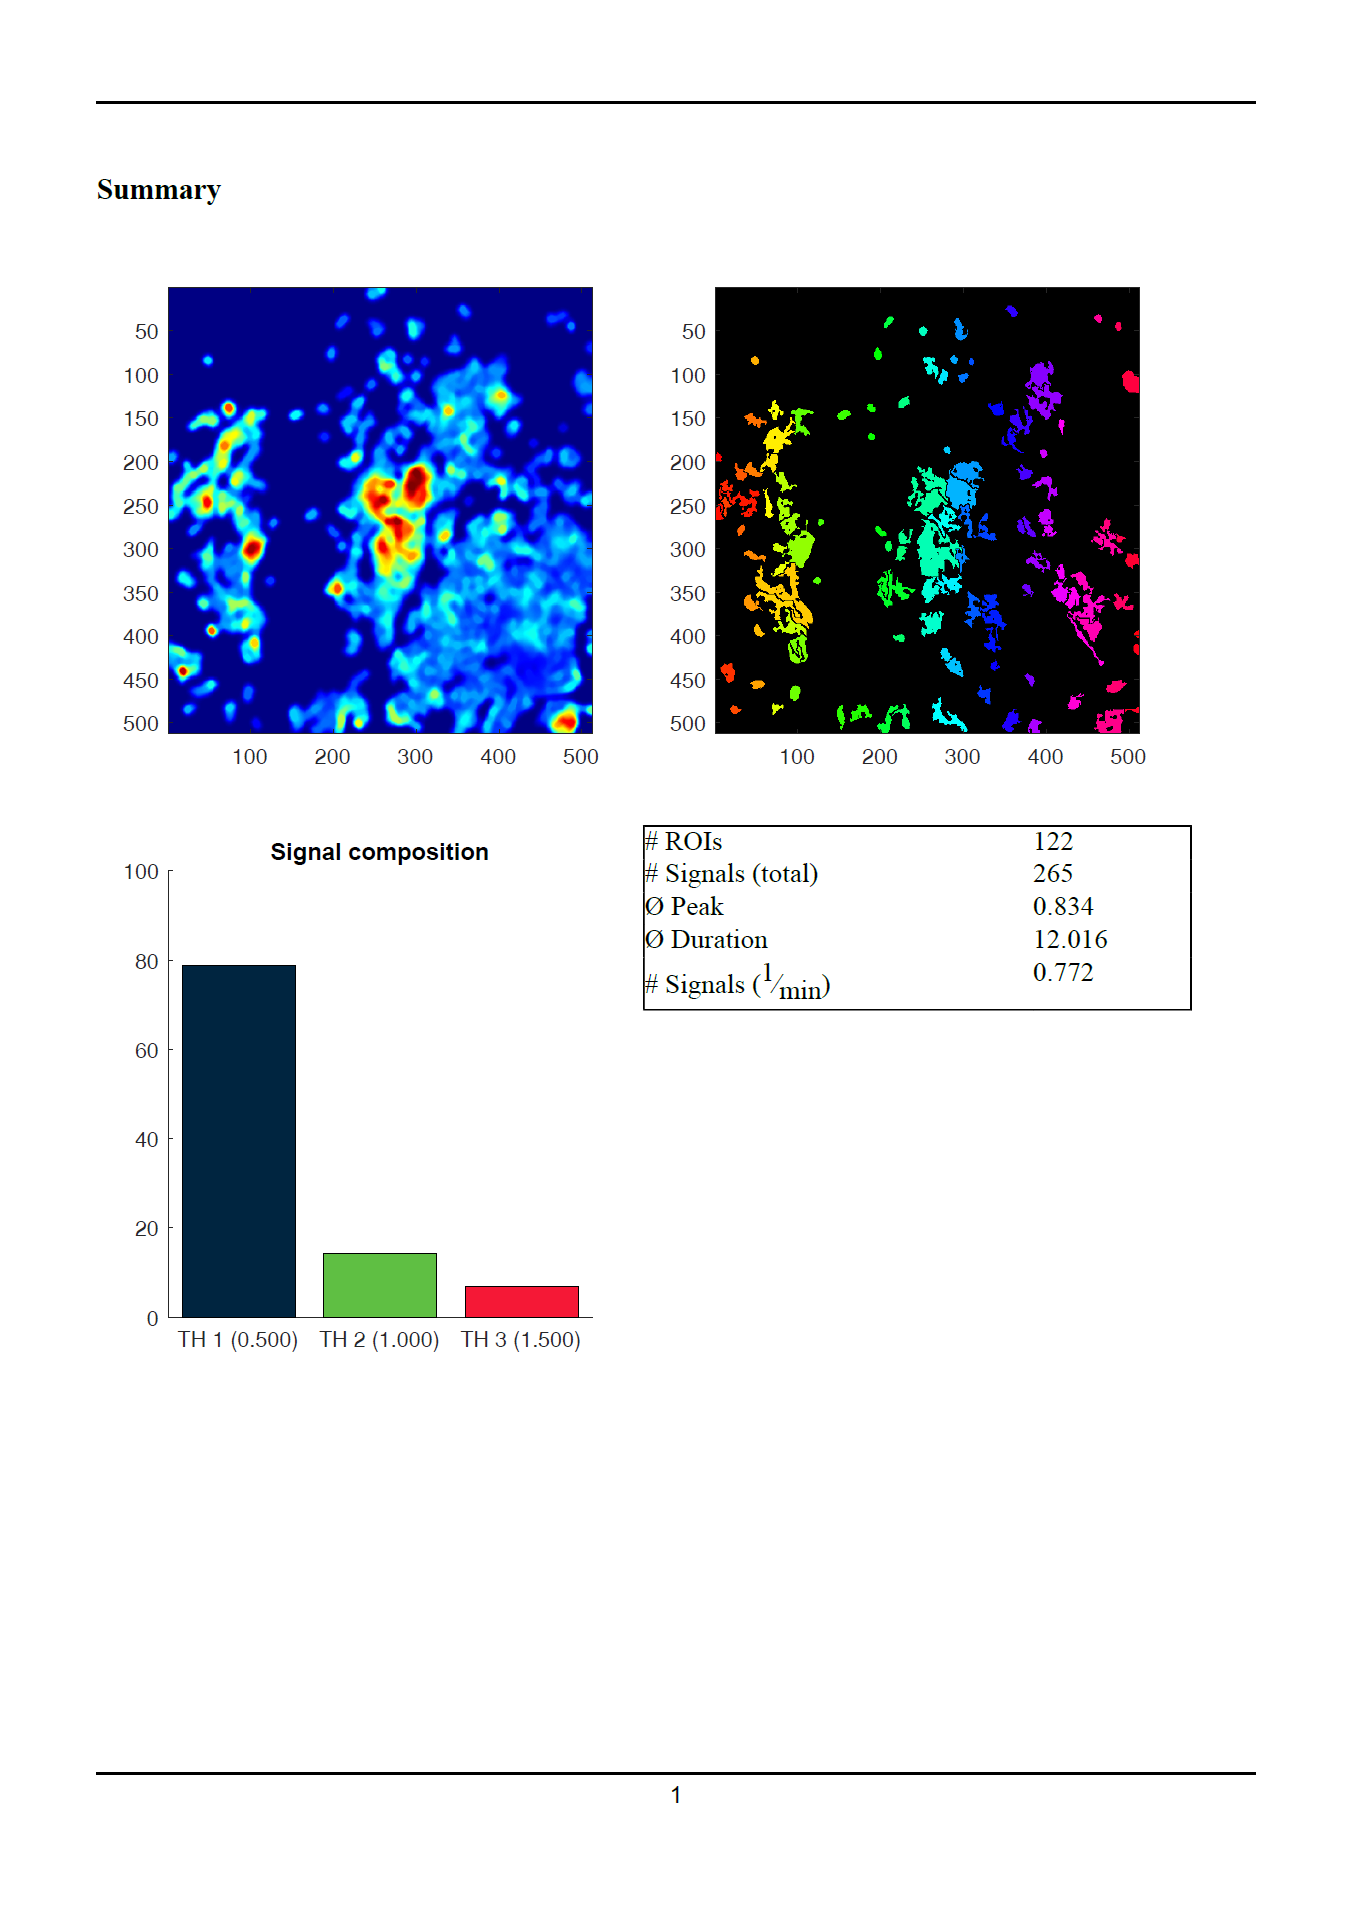
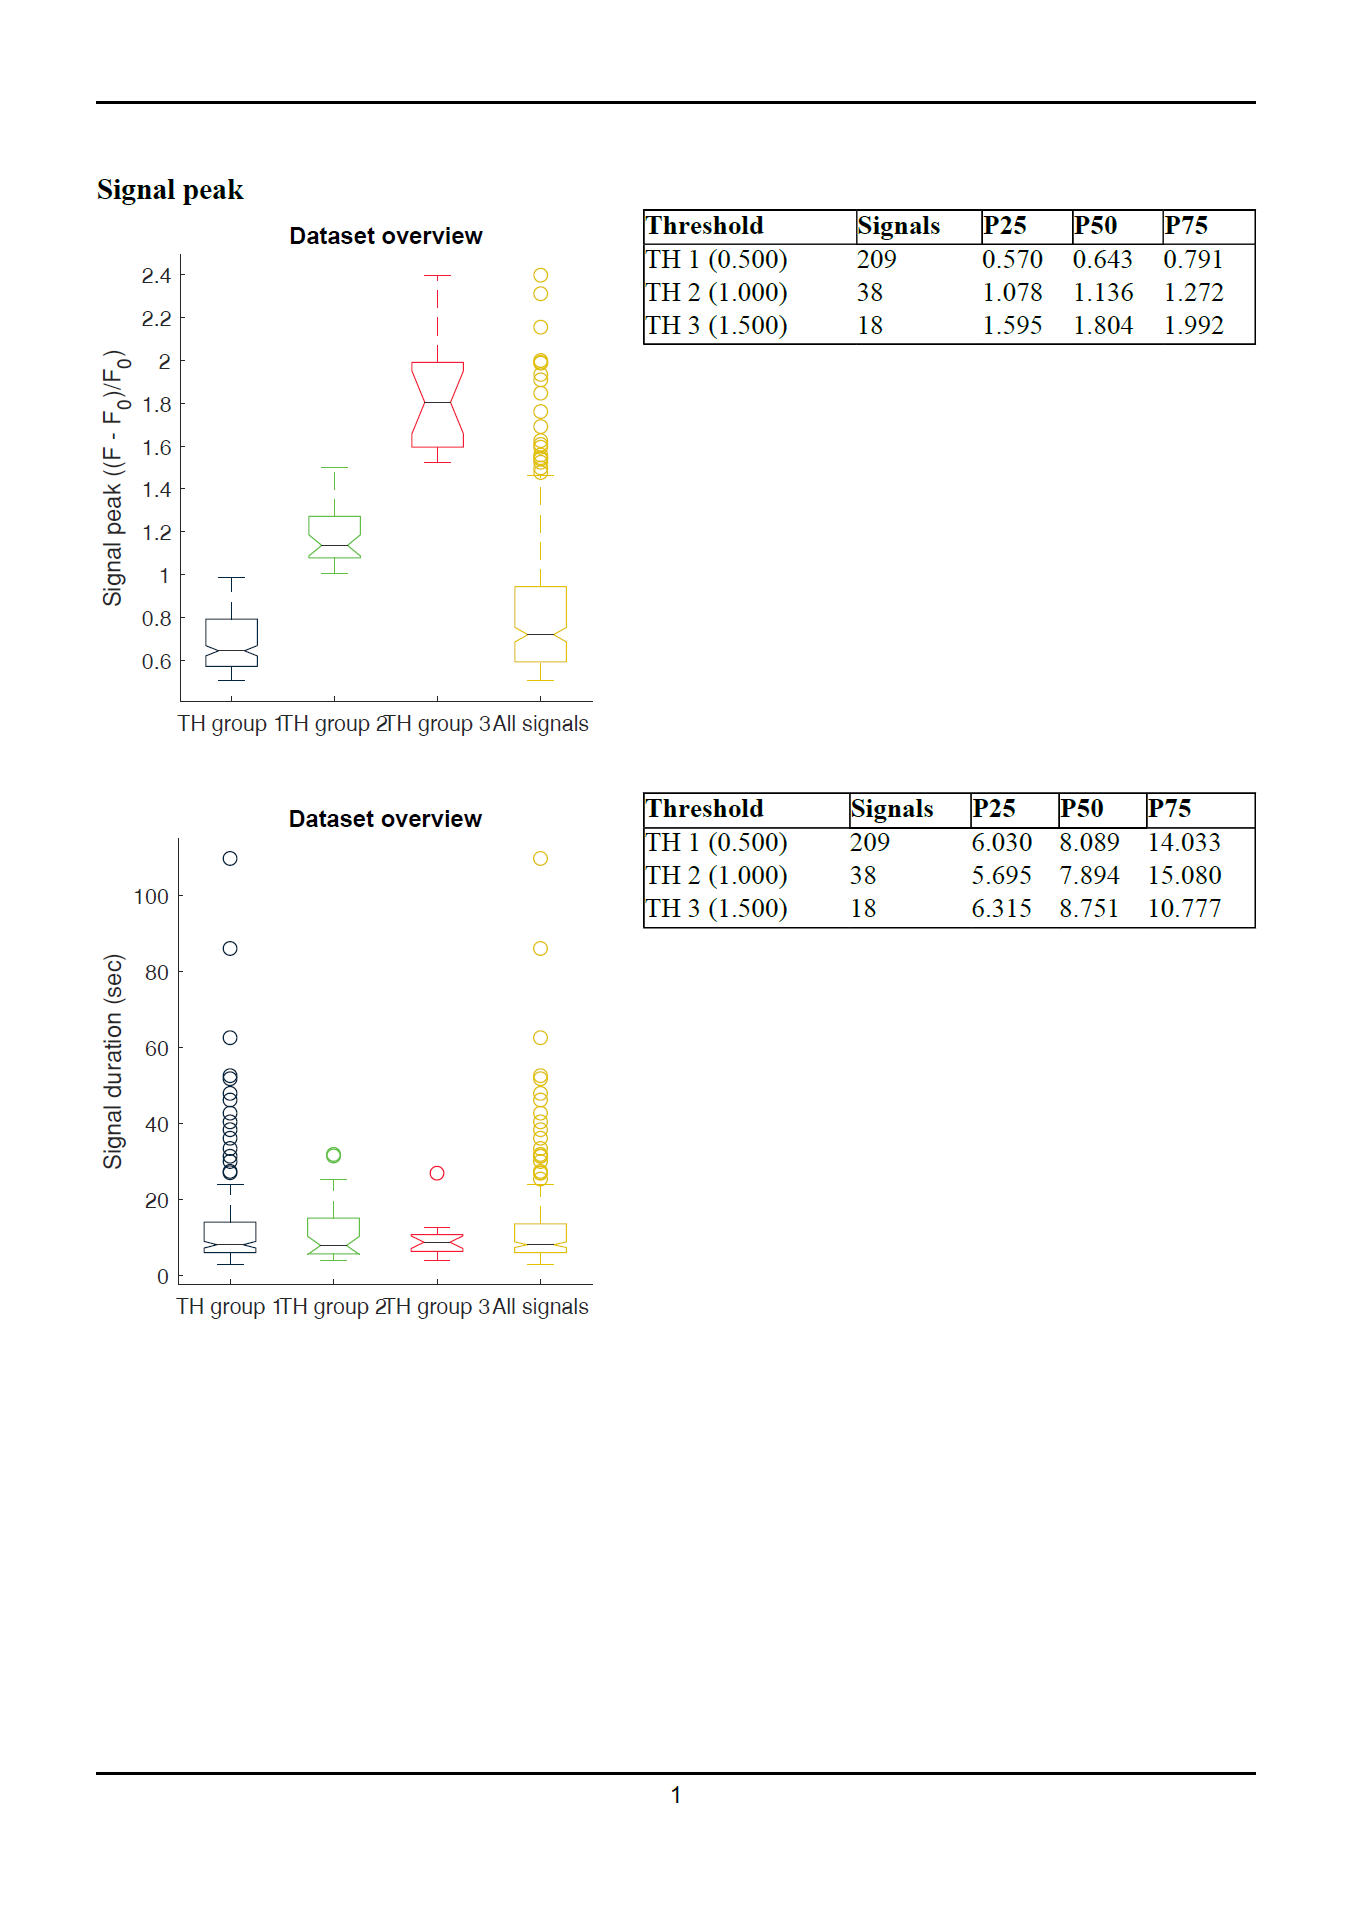
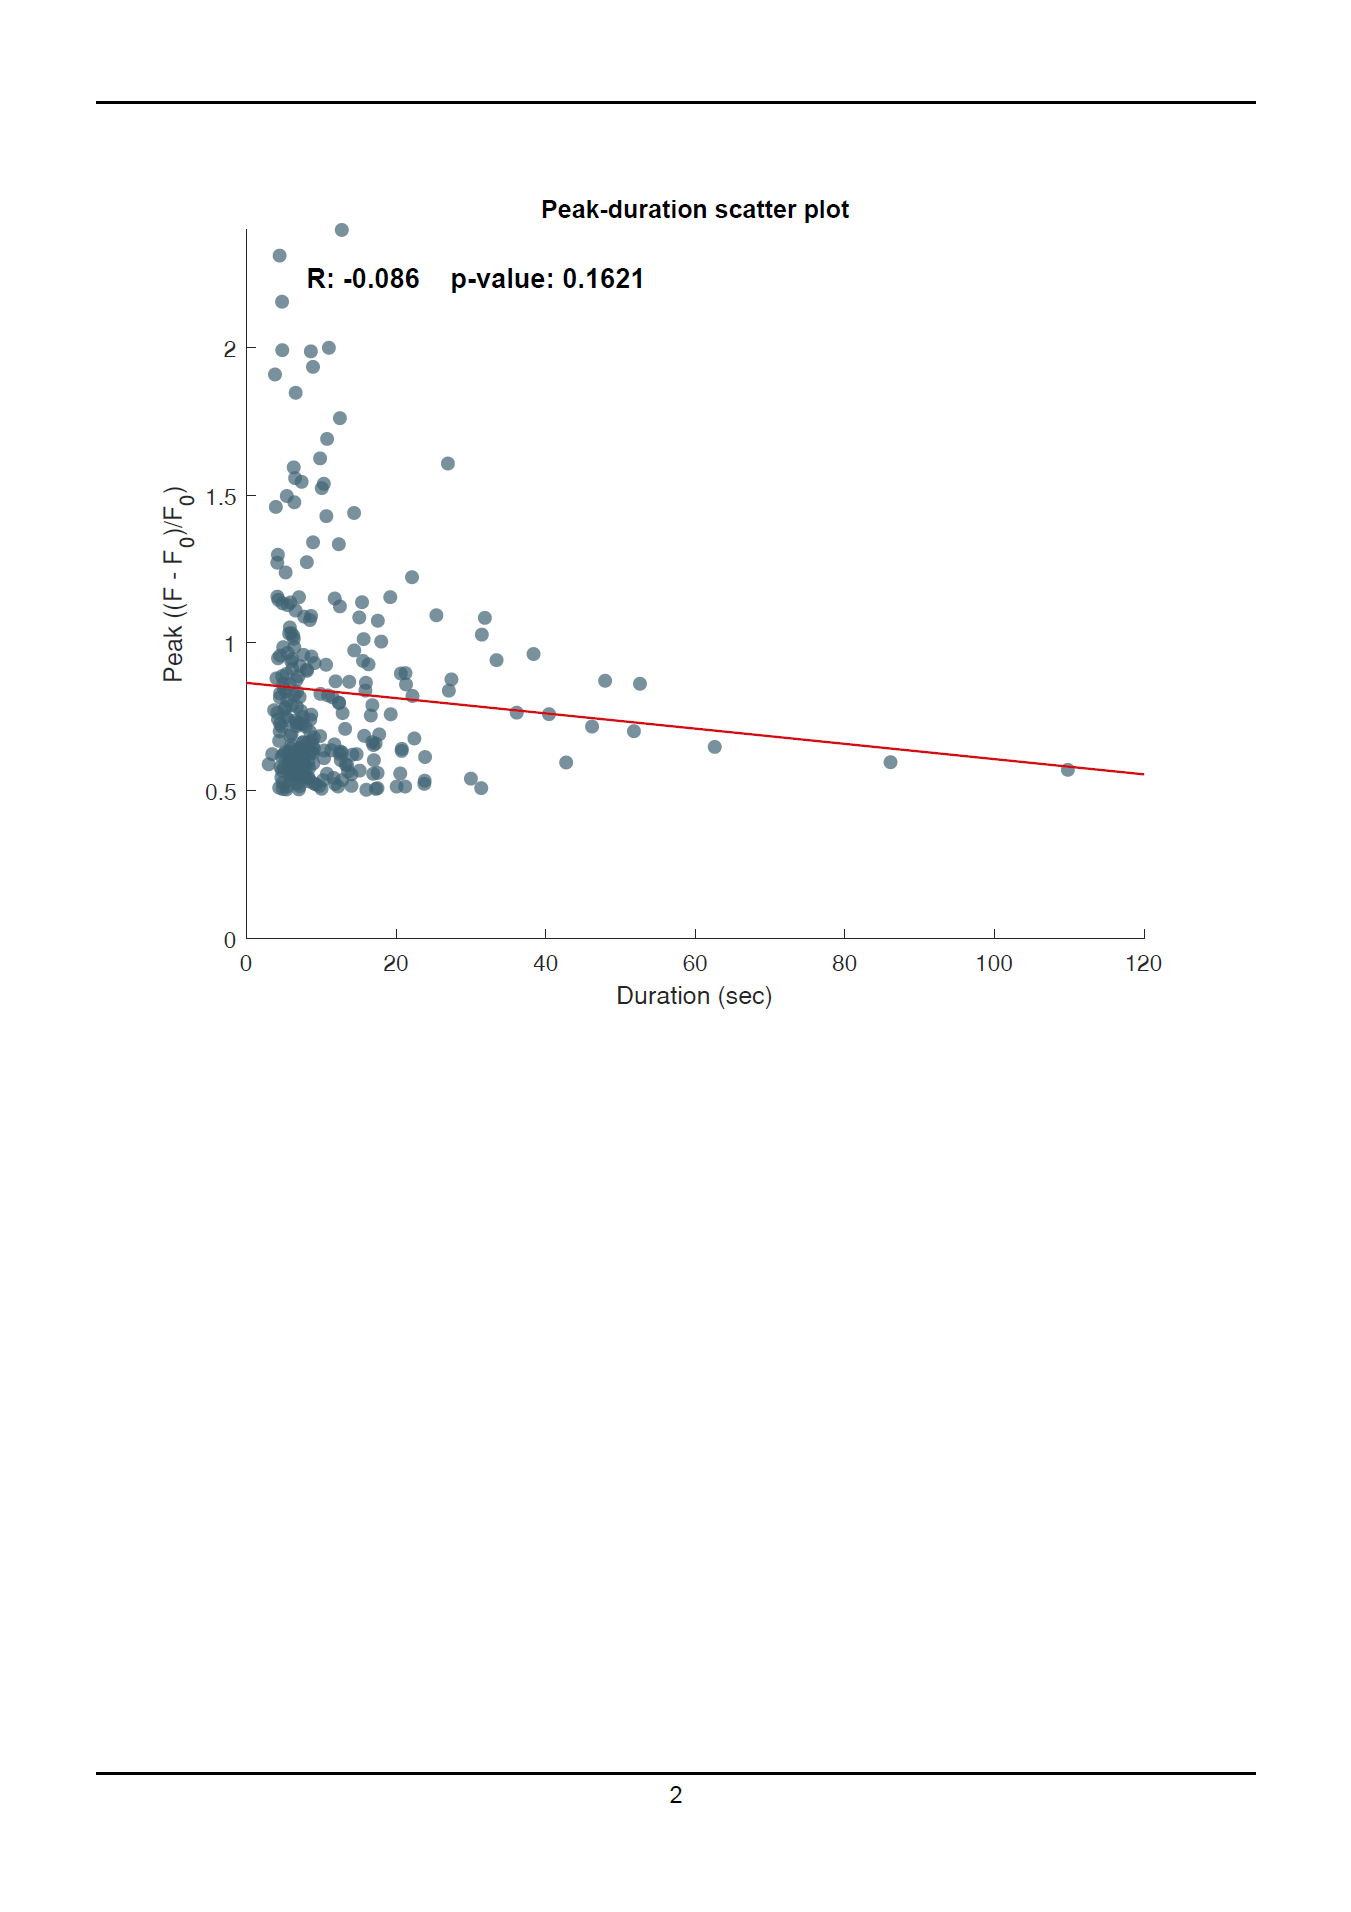
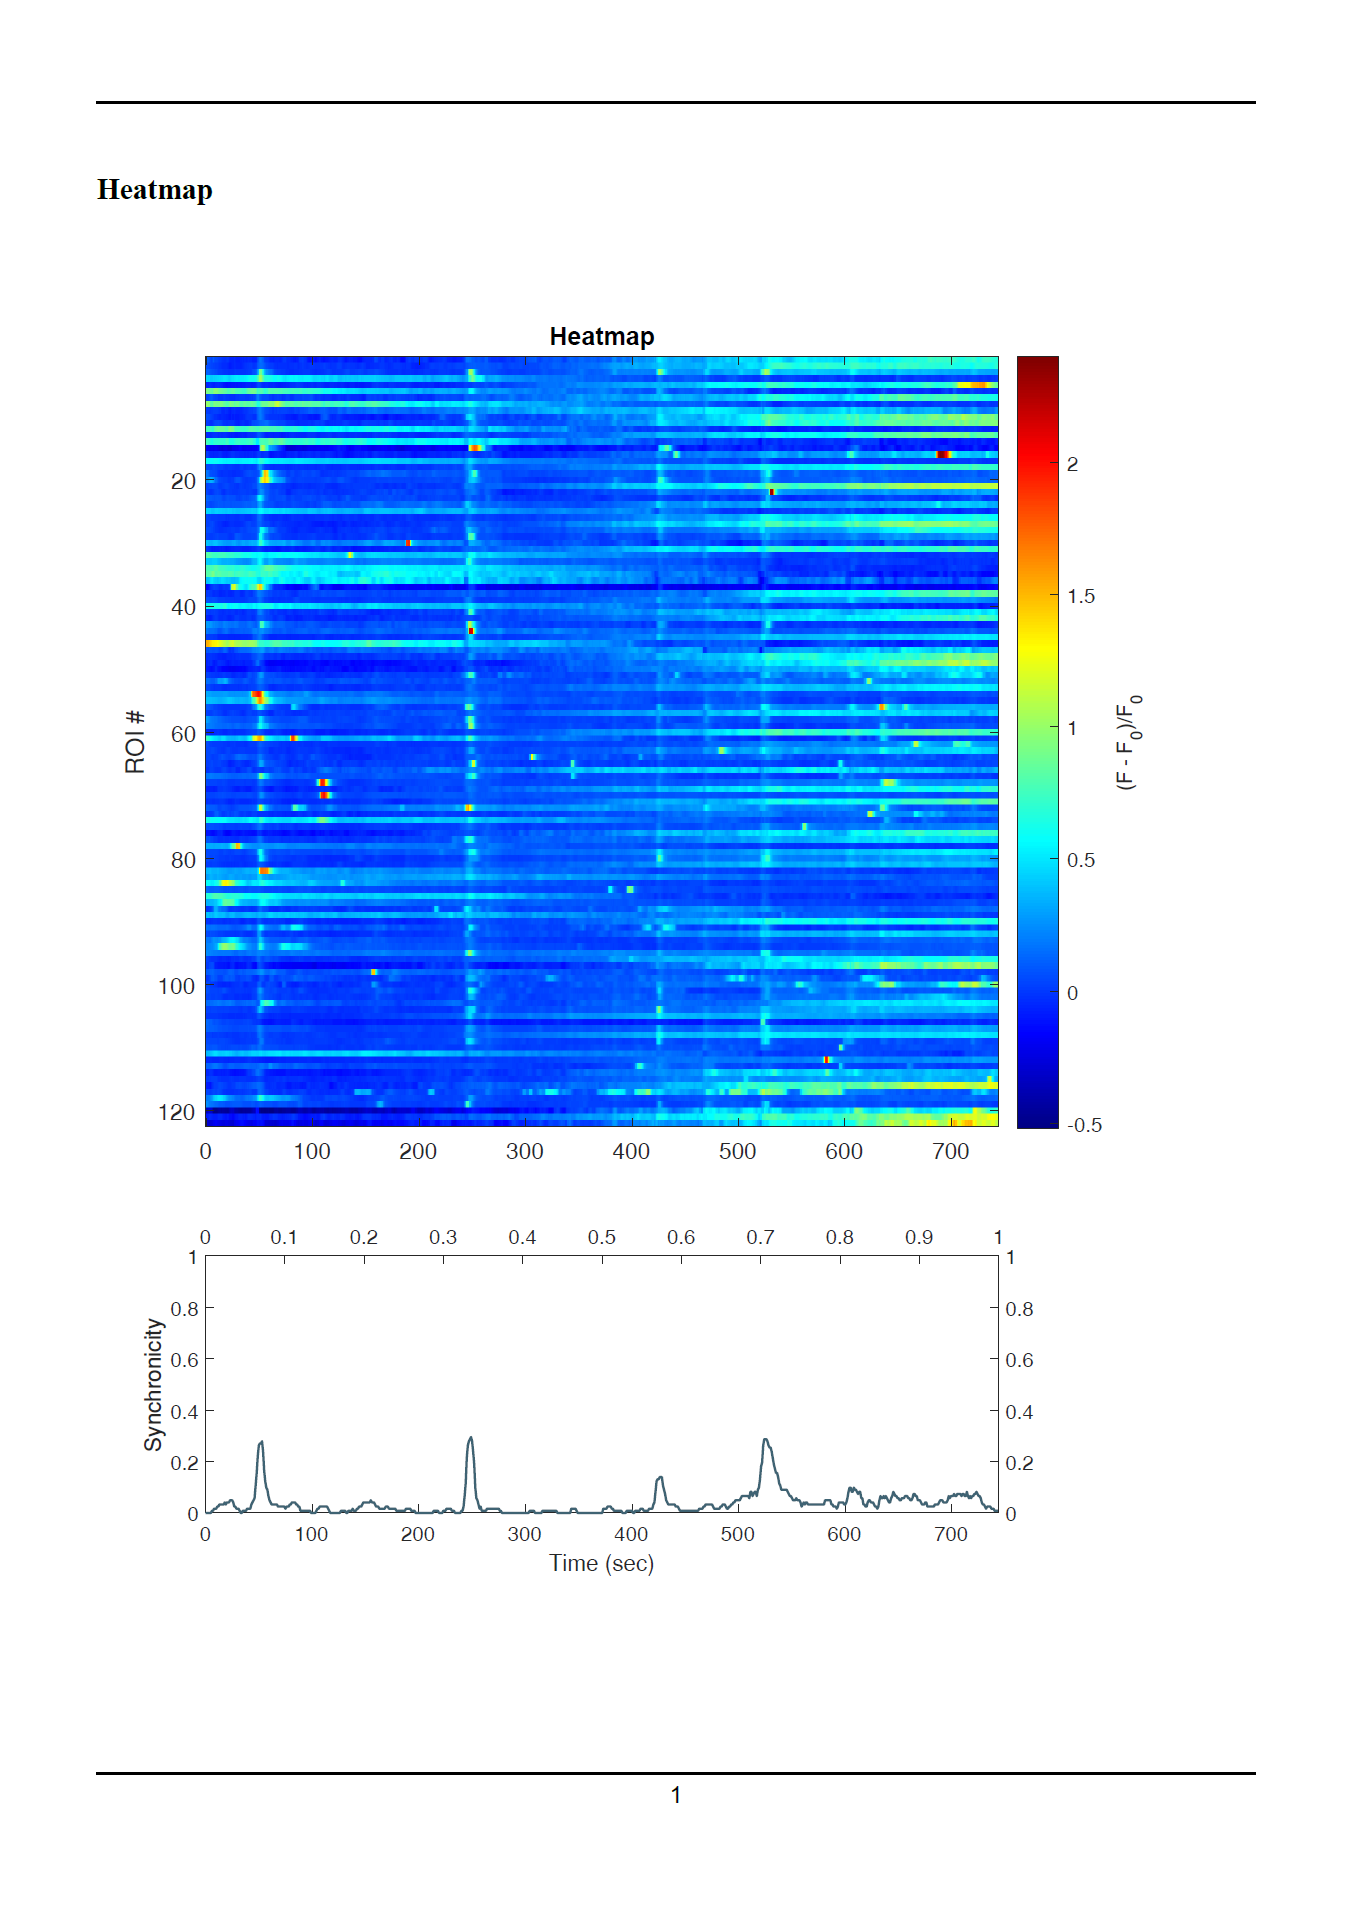
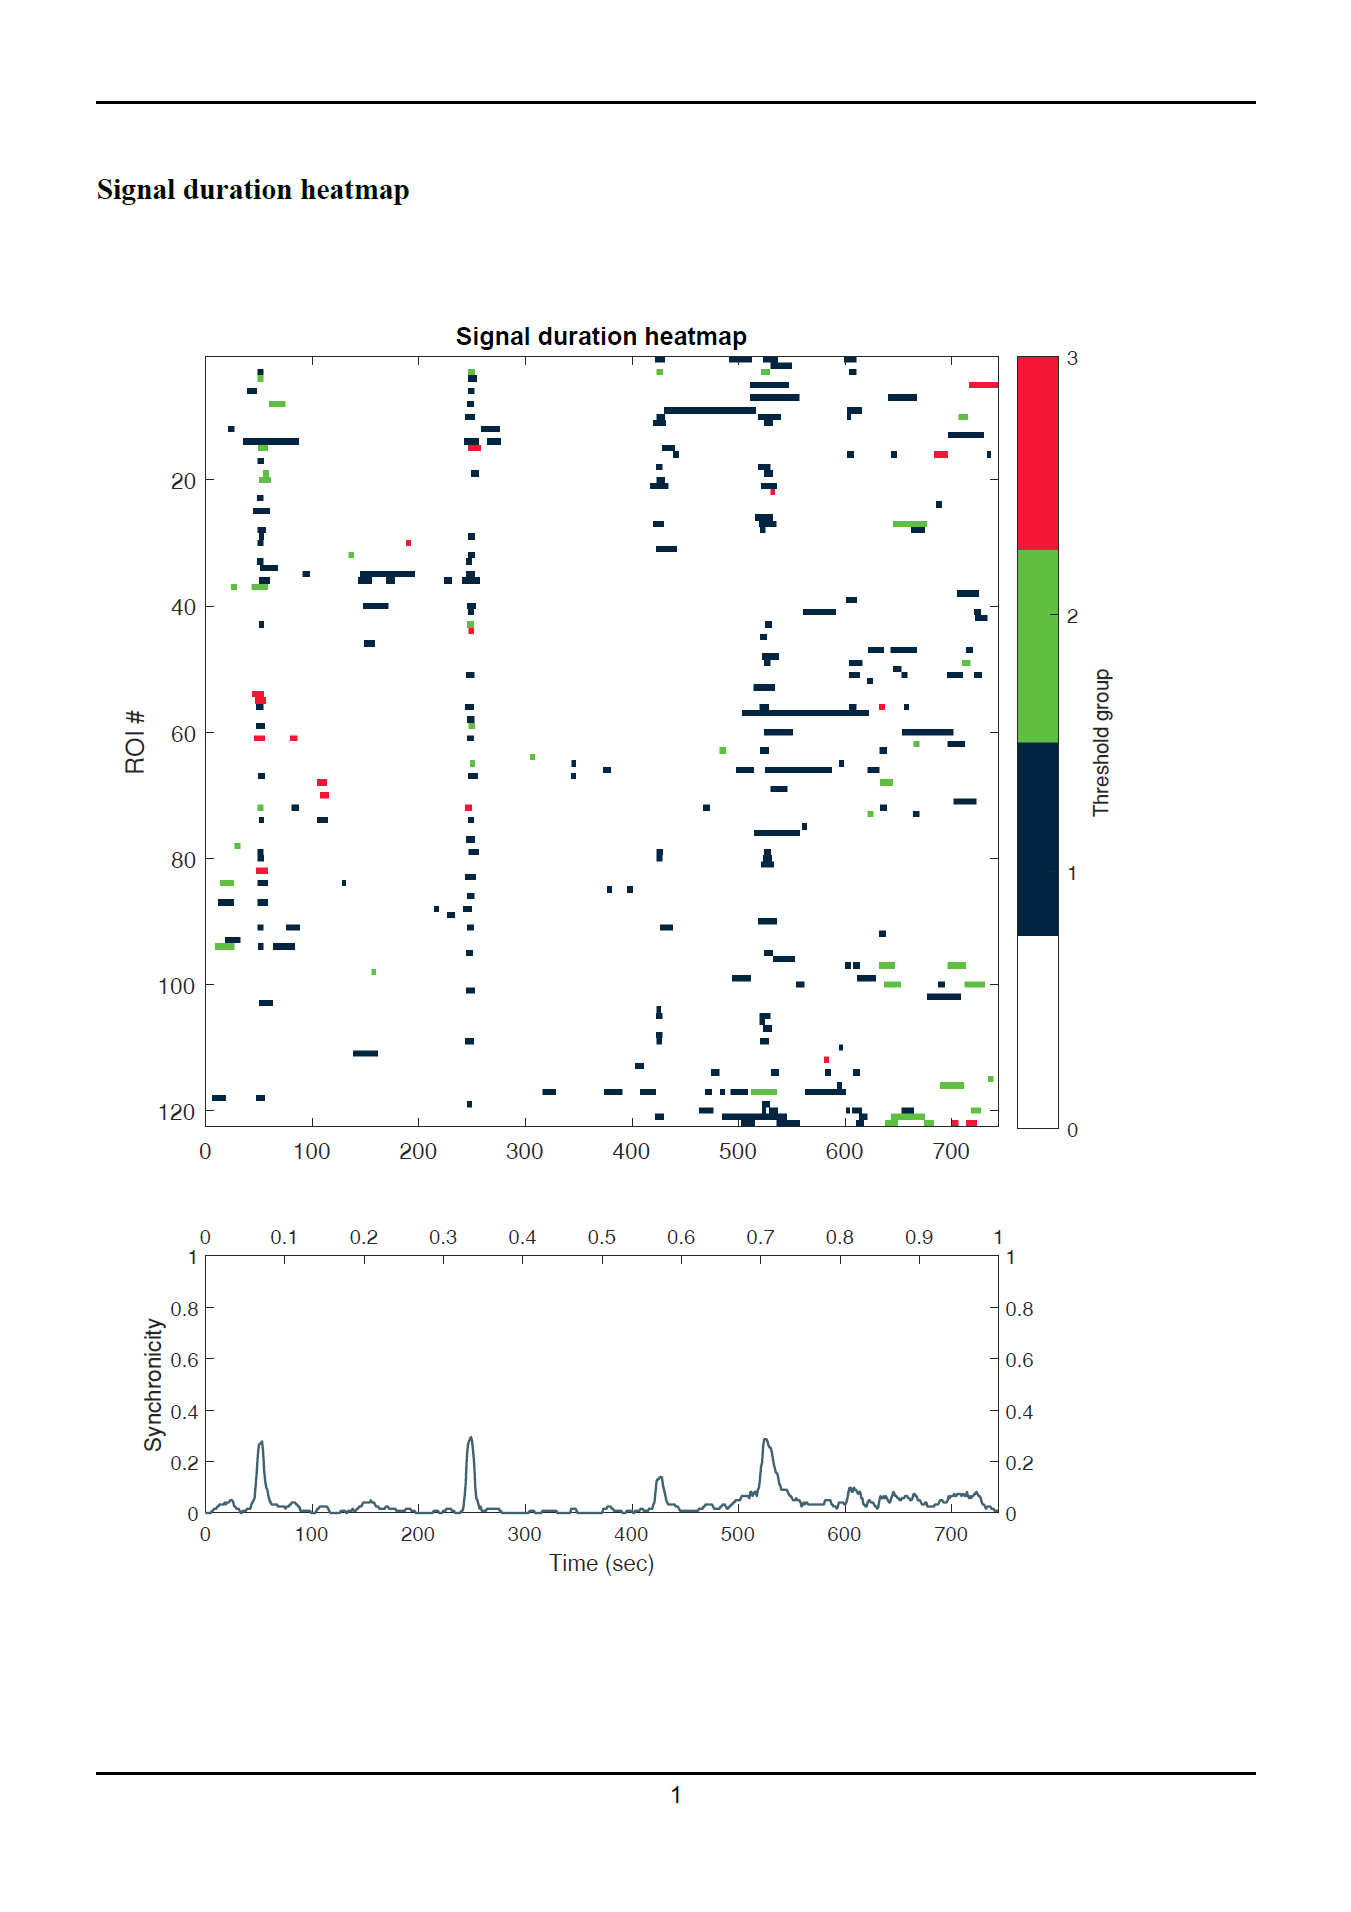
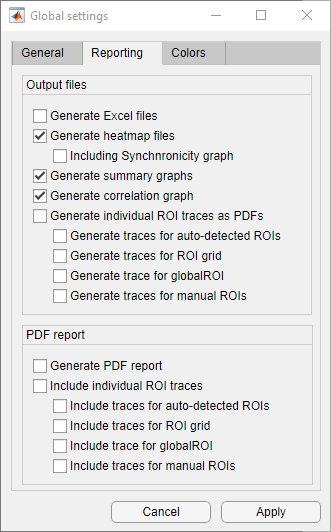
MSparkles can automatically generate a PDF report for each configured analysis. Each report begins with general information about the used version of MSparkles, metadata and analysis date. This is followed by a detailed list of used parameters for pre-processing and F0 estimation. All graphs and heatmaps in a report are vector graphics, this way they can be easily copied, edited, or, directly be used as figures.

Included figures

Each report contains the following graphs, detailing information about a speciffic dataset.

Graph nameDescription
ROI mapGraphical representation of the analyzed ROIs concerning this report.
Signal compositionGraph, showing the percentage of each threshold group.
Dataset overviewScatter plots with highlighted outliers, showing the spread per threshold group for 1) signal peak and 2) signal duration.
Correlation plotCorrelation between signal peak and signal duration, including trend line and correlation coefficient.
HeatmapHeatmap representation of complete time-course per ROI.
Signal duration heatmapOnly extracted and classified signals are depicted, using the colors of their respective threshold group.


Additionally, a report can also contain individual ROI trace plots. This feature however is disabled by default, because it may take a very long time to generate a PDF files with large amounts of graphics.

140x140
140x140
140x140
140x140
140x140
140x140
140x140
140x140

Settings

Reporting is enabled by default. If you want to disable report generation or control how detailed your reports should be, you can do this in the program settings via the toolbar. Here, you can also enable or disable the generation of individual PDF files for heatmaps or individual ROI traces.
Please keep in mind that generating reports may have a considerable impact on computation time.

140x140