Signal definitions & derived signal properties
A key feature of MSparkles' signal analysis is automatic signal classification into three groups: weak, medium and strong. This classification is based on a signals peak strength, and by default is calculated automatically based on the mean value (μ) and the corresponding standard deviation (σ) over all ROIs. Weak, medium and strong signals are then classified as >μ+σ & <μ+2σ , >μ+2σ & <μ+3σ and >μ+3σ, respectively.
SInce this is a purely statistical classification, based on internal statistics of a dataset, classfication boundries between datasets can vary. For this reason, MSparkels provides the possibility to manually define signal classification thresholds. Using manual thresholds thus allows direct comparison of datasets. In addition, the number of manual datasets is not limited.
In any case, for a local maximum to qualify as a valid signal peak it must surpass the lowest classification threshold.
ROIs without any valid signal peak are automatically removed. This step is performed before the actual signal analysis and classification is carried out in order to ge more meaningful results.
Signal analysis also has the option to exclude sub-signals. This option has the effect to only count the strongest peak of a multi-peak signal. A signal is defined as a multi-peak signal, if other signal peaks appear within a signals lifeime (duration), i.e. multiple signal peaks and durations overlap. Please note, that the behaviour of this feature is heavily affected by the percentage chosen to compute the signal duration.
Based on defining a signal on a local maximum of a ROIs time course, MSparkles automatically computes the following signal properties.
| Property name | Description |
| Peak height |
The (local) maximum of a ROIs time course. |
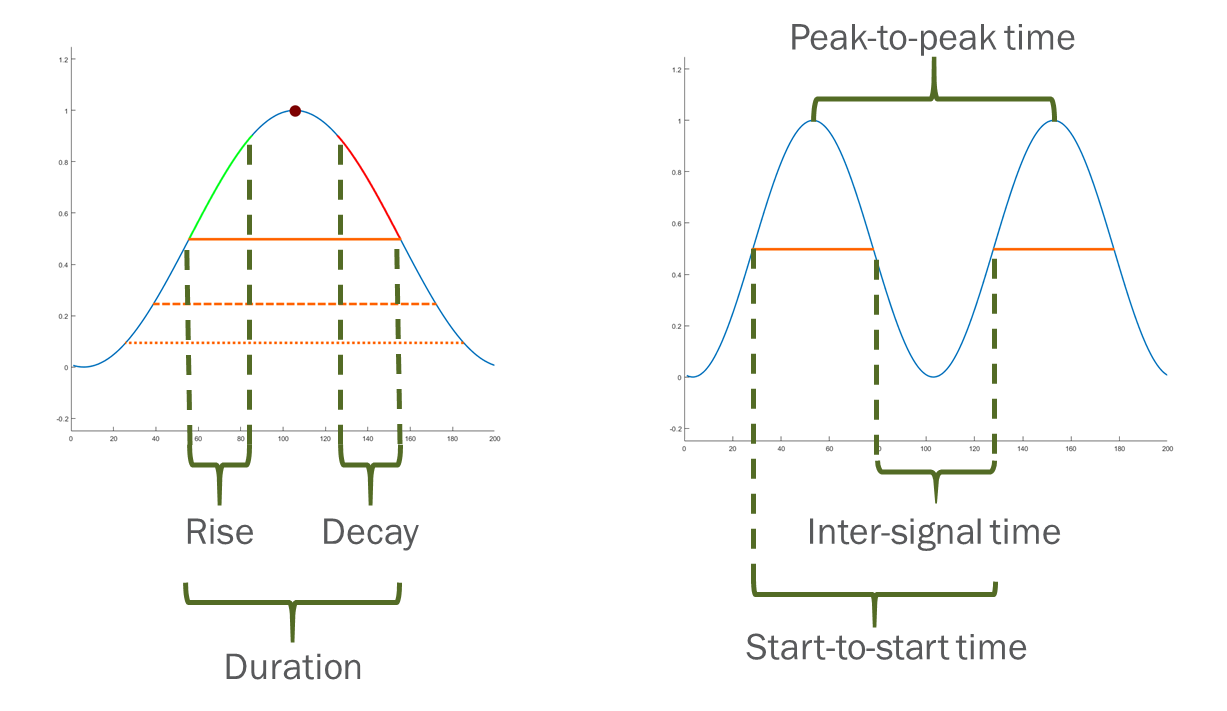
| Duration |
By default, duration is defined as full width of the signal curce at half maximum (FWHM). However, MSparkles allows to also define it as full width at 25% or 10% if maximum. This way, a more precise estimation of the actual signal duration can be made. |
| Signal start time |
Intersection of the 'left' side of the signal curve with the horizontal line at the selected level for measuring the signal duration. |
| Signal end time |
Signal start time plus signal duration. |
| Rise time |
Time between signal start and the point where the signal reaches 90% of its peak value ('left' of the peak). |
| Decay time |
Time between 90% of the peak value ('right' of the peak) and signal end. |
| Peak-to-Peak time |
Time difference between two consecutive signals |
| Signalling frequency |
Mean value of all Peak-to-Peak times of a ROI divided by the number of signals. |
| Inter-signal time |
Time between signal end and signal start of two consecutive signals |
| Start-to-Start time |
Time between signal starts of two consecutive signals |
| ROI area |
Area covered by a ROI in domain units, specified in a dataste's metadata. |
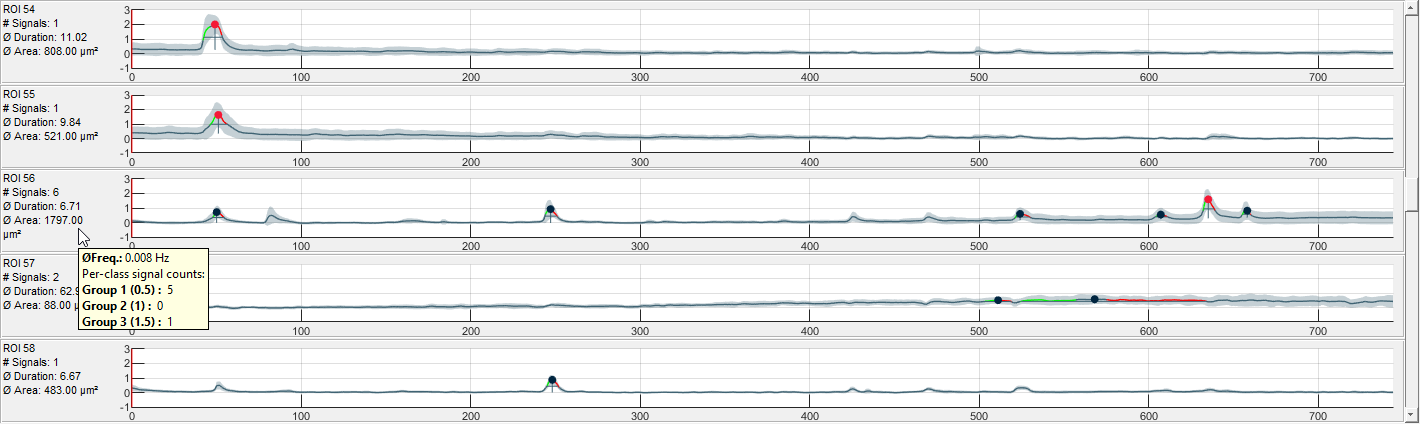
MSparkles' results inspector provides a clean an simple overview of all analyzed ROIs. It shows the each ROIs time course with classified signals, durations as well as rise and decay times. Additionally, the standard deviation of the time course is shown to indicate teh quality of the signal. On the left-hand side of the time course, an overview of some signal properties is presented.
 Signal analysis