 Explore your data
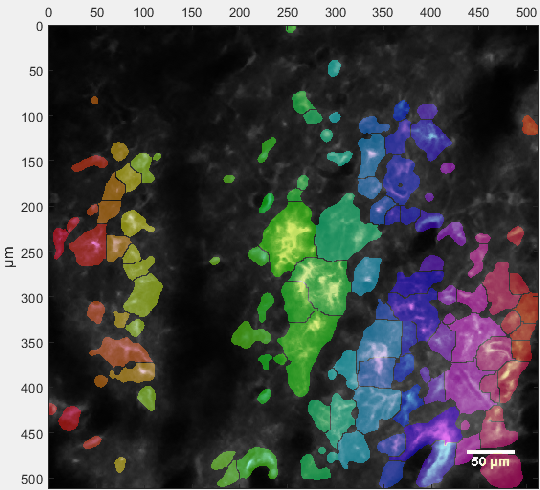
Once you have loaded a dataset MSparkles displays its contents in the preview window. Here you can browse through your data, play the stack and scroll through all your channels and Z-layers. Built-in visualization methods help to find interesting phenomena. Multi-channel images can be displayed as a channel-merge. MSparkles' display-adjustment dialog allows to configure individual brightness, contrast, γ-correction as well as merge color per channel. To visualize individual channels, MSparkles provides various color maps. Temporal differences allow to visualize frame-to-frame increase and decrease of fluorescence levels. Visualization of the fluorescence range allows to extract absolute differences w.r.t. a pixels minimum value over time. Translucent ROI overlays provide a spatial relation of active regions to the underlying tissue or structure.
Hovering your mouse pointer over the preview window will display the time course of the point under the mouse pointer in the trace inspector.
Selecting a ROI in the preview window (or in the Project manager) will display the trace of that ROI in the trace inspector and highlight it in the results view.
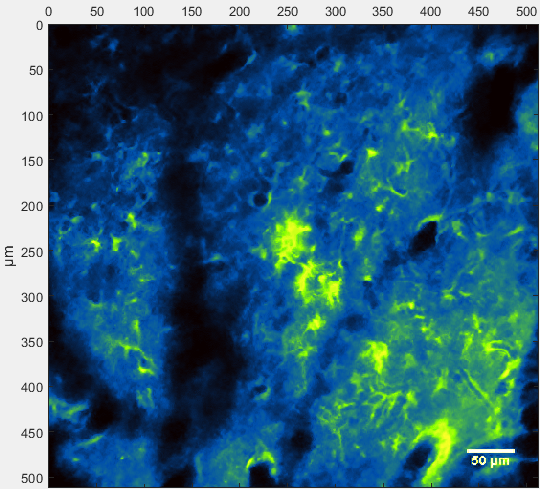
Colormap highlighting highly fluorescent regions (green) in the unprocessed image. Regions with little or no fluorescence appear darker (blue and balck, respectively).
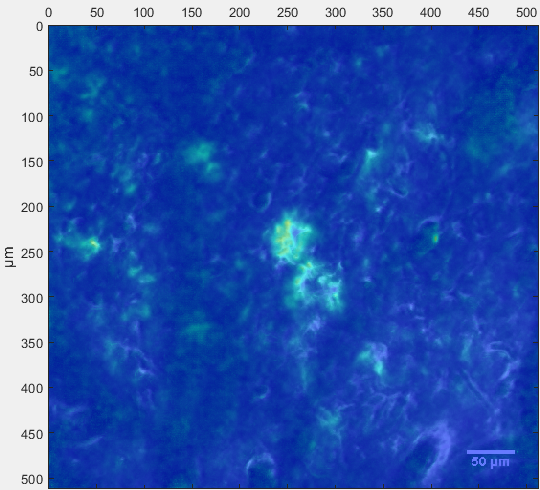
Fluorescence range visualization shows active regions (bright / turquoise) and less active regions (dark / blue) w.r.t. each pixel's individual minimum over time.
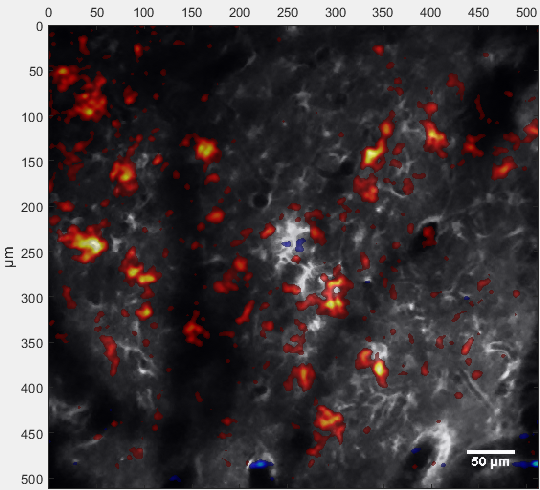
Temporal difference visualization shows increases in fluorescence (red) and decreases in fluorescence (blue) w.r.t the previous frame.
All these visualizations can of course be used for video export.