140x140Excel export

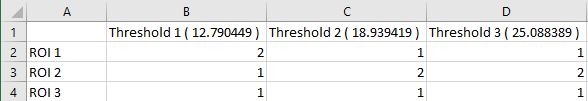
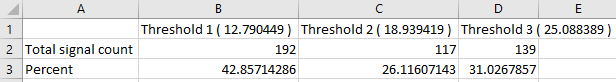
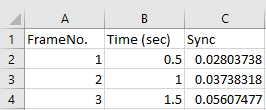
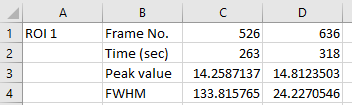
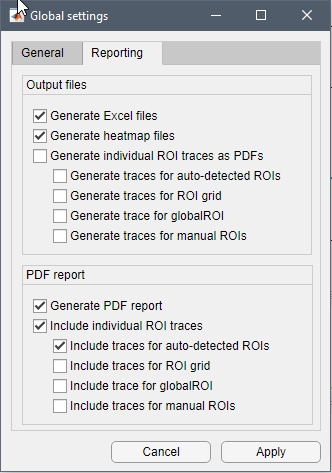
By default MSparkles generates an Excel file for each analysis mode. These files can grow quite rapidly and become pretty complex. To tackle this complexity, MSparkles automatically sorts the generated data into several worksheets. These worksheets are grouped according to the three signal categories based on signal strength. For each signal category the following worksheets exist.

Please note: Microsoft® Excel® must be installed on your computer to use the Excel export feature!

Table nameDescription
Traces    

Contains the complete trace for each individual ROI.

Signal counts    

Lists the number of detected signals per ROI for each threshold level.

Signal composition    

Shows the absolute number of signals per threshold level with respective percentages.

GraphPad    

Condensed view of signal peaks, respective frame numbers and signal duration per threshold level plus additional columns containing all peaks, frames numbers and durations. The main purpose of this table is to have the most important information to copy to statistics tools (e.g. GraphPad prism).

Synchronicity    

Contains the synchronicity index per frame, where 1 indicates full synchronicity in all detected ROIs and 0 indicates no activity at all.

Signals TH *    

The signals tables contain the detected signals per ROI with corresponding frame number, time in seconds, peak values and duration as FWHM. An individual signals table is created for each threshold level.

Settings

Excel export is enabled by default. If you want to disable Excel export, you can do this in the program settings via the toolbar. Here, you can also enable or disable the generation of individual PDF files for heatmaps or individual ROI traces.

140x140